2. Explain to the class that they are now ready to study the relationship between loudness and pitch. Challenge students to explain the difference between these two properties of sound and to provide some practical illustrations of this difference.
80
Students should understand already that loudness is described using words such as loud and soft, whereas pitch is described by words such as high and low. Students should be able to explain that both the low-pitched keys on the left of a piano keyboard and the high-pitched keys on the right can be played softly or loudly. Similarly, males (with lower-pitched voices) can sing as loudly or as softly as females (with higher-pitched voices).
3. Ask the class to recall that sound travels as vibration. Explain that the physical basis of a sound’s pitch is its frequency, or the number of vibrations per second.
Sounds of rapid vibrations are perceived as higher in pitch than sounds of slower vibrations. The unit hertz (abbreviated Hz) is used to measure the pitch (frequency) of sound. For example, a sound with a pitch of 262 Hz vibrates at a rate of 262 times per second, which corresponds to middle C on a piano.
4. Explain to the class that they will use a Web-based activity to investigate the relationship between loudness and pitch and to understand the human hearing response to sound.
5. Have students proceed to http://science.education.nih.gov/supple-
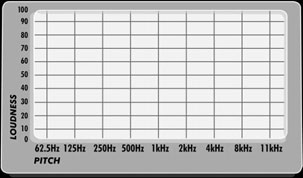
ments/hearing/student and click on “Lesson 3—Do You Hear What I Hear?” After listening to the introduction, you will advance automatically to a page containing a large graph, the loudness-pitch square.
Students should pay close attention to the introduction. It explains how changes in wave amplitude reflect soft versus loud sounds, and how changes in frequency reflect low- versus high-pitched sounds.
Figure 3.4. The loudness-pitch square.
81
Student Lesson 3

How Your Brain Understands What Your Ear Hears
6. Explain to the class that they will perform two tasks using a loudness-pitch square. First, they will investigate the relative loudness of sounds at different pitches. Then, in Part 2, they will construct a hearing-response curve.
Content Standard A:
Use appropriate tools
Students may work in teams, although each student should collect his or her own data.
and techniques to
gather, analyze, and
7. Distribute to each student a copy of Master 3.3, Loudness and Pitch.
interpret data.
8. In the first task, students select the lowest frequency (62.5 Hz) and click on a point halfway up the y-axis (50 on the loudness axis).
Depending on your computer, sound card, and speakers, you may not be able to hear the lowest or highest frequencies, even at the maximum intensity. Also, students might hear a very short “squeak”
initially. Tell them to ignore this noise and listen for a constant, uniform tone.
9. For the first constant, uniform tone that students hear at 50 on the loudness axis, tell them to assign that tone a value of 1 (on a scale of 1 to 10).
Other tones may be louder than this one, and they will be assigned an arbitrary number relative to 1.
10. Students should then select the next higher frequency on the graph, clicking on the point at the same vertical height as before (50 on the loudness axis). Instruct students to assign the tone a numerical value based on its loudness relative to the first detectable tone (see Step 9). For example, if you think the second tone is twice as loud as the first, then you should assign the second tone a value of 2. This process is repeated for each of the remaining frequencies, always clicking on the same point on the loudness axis (at 50) for each frequency. Students should then enter their results on Master 3.3, Loudness and Pitch.
11. Instruct the students to answer the discussion questions on Master 3.3, Loudness and Pitch.
82
Question 1. Did the sounds produced at each frequency seem equally
loud? How did the loudness change with frequency?
Sounds vary in loudness as pitch (frequency) increases. At the low end of the spectrum, the sounds seem louder as frequency increases.
As one moves up the spectrum, however, loudness seems to decrease at the higher frequencies.
Question 2. Why did you hear variation in loudness with changing
pitch?
The hearing system’s sensitivity to loudness varies with the frequency of the sound. Generally, the ear is most sensitive to sounds in the 3-to-4-kHz region. Sounds outside of this range must be more intense to be perceived as loud. Any student answer that relates this phenomenon to the functioning of the human hearing system is acceptable.
PART 2—HEARING-RESPONSE CURVE
Teacher note
In this second task, students generate a hearing-response curve. This curve has no clinical value and should not be viewed by students as an indication of whether or not they have a hearing impairment. However, if a student has responses that are well outside the norm and is concerned, encourage him or her to see the school nurse, a doctor, or an audiologist. The purpose of this task is to explore the different sensitivities of the human ear to different pitches. If you or the students have not already calibrated the sound level of their computer as described in the Preparation section at the beginning of this activity, instruct them to do so now.
1. Give each student a copy of Master 3.4, Hearing Response.
2. Instruct students to start with the 62.5-Hz frequency and play the tone at the lowest setting for loudness. If they do not hear the tone, they should increase the loudness by clicking on a higher point on the vertical axis at that same frequency. They should continue this process until they find the loudness setting at which they can first hear the tone. Direct students to enter this loudness value in the appropriate space on Master 3.4, Hearing Response.
Note: the lowest frequency the students hear may be at 250 Hz, 125 Hz, or 62.5 Hz depending on the quality of the computer’s sound card and speaker system.
83
Student Lesson 3

How Your Brain Understands What Your Ear Hears
3. Students repeat this process for each of the higher frequencies by clicking on the lowest loudness setting and gradually increasing the volume. As before, they should record the loudness at which Content Standard A:
they first hear the tone. In the end, students will collect data repre-Use mathematics in all
senting the minimum relative loudness at which tones of various frequencies first can be heard.
aspects of scientific
inquiry.
Note: that at the two highest frequencies, students might hear a very short “squeak” initially. Instruct them to ignore this noise and listen for the loudness setting at which they hear a constant, high-pitched tone.
4. Direct students to plot their results on the graph template provided on Master 3.4, Hearing Response. You can use an overhead transparency of Master 3.4 to explain how to create the graph.
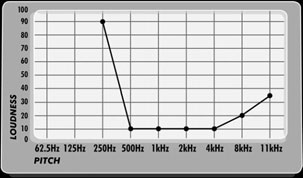
Student results will vary, although the shapes of their curves should be similar. The values on the y-axis are high at the lowest frequencies, drop for frequencies from 500 to 4,000 Hz, and slowly rise beginning around 8,000 Hz .
Figure 3.5. A sample hearing-response curve.
5. Instruct the students to answer the discussion questions on Master 3.4, Hearing Response.
Answers to questions on Master 3.4, Hearing Response, follow:
Question 1. At what frequencies is your hearing most sensitive? Circle
these frequencies on your graph.
84
Hearing is most sensitive at those frequencies for which sound can be detected at the lowest loudness levels. Human hearing is most sensitive at frequencies associated with human speech (between 250
and 4,000 Hz).
Question 2. As we get older or are repeatedly exposed to loud sounds,
we tend to lose hearing at higher frequencies. How might the hearing-
response curve change for an individual with high-pitched hearing
loss?
As hearing loss occurs, progressively louder sounds are required for higher-pitched sounds to be heard. The hearing-response curve for a person with high-pitched hearing loss would show a steeper curve on the part of the graph corresponding to high frequencies. Because louder sounds cause damage to hair cells, a mild hearing loss can lead to even greater hearing loss.
PART 3—HIGH-PITCHED HEARING LOSS
1. Explain to the class that they are now ready to investigate the effect of high-pitched hearing loss on the understanding of sounds.
Challenge students to predict how speech would sound if the high pitches are removed, or “filtered,” from a sound file.
2. Explain that, as in the first lesson, students will again listen to someone reading the first sentence of President Lincoln’s Gettysburg Address. Explain that the first reading will be an unfiltered version. (This is the same track used in Lesson 1 and labeled
“traditional.”) The second reading has removed pitches above 4,000 Hz. The third reading has removed pitches above 2,000 Hz.
Instruct students not to change sound level settings while listening to the three recordings.
3. Have students proceed to http://science.education.nih.gov/supple-
ments/hearing/student and click on “Lesson 3—Do You Hear What I Hear?” Near the top of the screen, click on the link labeled “Filtered Sound.” Have students play each of the three sound tracks in the following order: normal; filtered 4,000 Hz; and filtered 2,000
Hz.
4. After the students have had an opportunity to listen to the unfiltered and filtered sound tracks, reconvene the class and ask the students the following questions:
a. Which sound track might simulate how an older person with high-pitched hearing loss would hear the passage?
85
Student Lesson 3

How Your Brain Understands What Your Ear Hears
Both the filtered 4,000-Hz and the filtered 2,000-Hz sound tracks simulate how a person with high-pitched hearing loss might hear the passage being read. The filtered 2,000-Hz sound track corresponds to a more severe hearing loss than does the filtered 4,000-Hz sound track.
b. Which sound track, filtered 4,000-Hz or filtered 2,000-Hz, is missing more pitches?
Pitches ranging from 2,000 Hz and above have been removed from the filtered 2,000-Hz sound track, while pitches ranging from 4,000 Hz and above have been removed from the filtered 4,000-Hz sound track. Therefore, the filtered 2,000-Hz sound track is missing pitches between 2,000 Hz and 4,000 Hz, which are present in the filtered 4,000-Hz sound track.
c. How does loudness change as the higher pitches are removed?
Loudness seems to decrease as pitches are removed.
d. How does your understanding of the words change as the higher pitches are removed?
Understanding becomes more difficult. Words seem to be less distinct. This is because some of the information provided by the sound has been lost.
e. How can a person compensate for such a hearing loss? What is the result of this compensation?
Assessment:
As hearing loss occurs, progressively louder sounds are required for Have students investi-hearing. An individual may turn up the volume on a television, gate the hearing
stereo, or radio or ask a speaker to talk louder. Students may have responses of another
noticed such behaviors exhibited by their grandparents or other animal such as a dog,
older adults. A person with such a hearing loss may elect to use a bat, or whale. Ask
hearing aid, which uses a microphone to collect and amplify sounds them to report on
coming into the ear. The hearing aid does not restore normal hearing their animal’s hearing
but can greatly aid hearing and communication.
range and compare it
with that of humans.
Ask them to predict
how high-pitched
hearing loss might
affect the animal.
86
Lesson 3 Organizer
Activity 1: Measuring Intensity
What the Teacher Does
Procedure Reference
Ring a small bell and challenge the class to suggest ways of Page 77
making the bell ring louder.
Steps 1 and 2
Introduce the concept of the physical basis of loudness and Page 78
the decibel scale using Masters 3.1, The Decibel Scale, and Step 3
Master 3.2, Sound-Intensity Table.
Have the class complete Master 3.2, Sound-Intensity Table, Pages 78–79
and discuss their answers.
Steps 4 and 5
Instruct the class to answer the questions on Master 3.1, The Page 79
Decibel Scale.
Step 6
Discuss the relationship of loudness to human communication.
Page 79
• Ask why a sound may seem loud to one person but
Steps 7 and 8
not to another.
• Ask how sound intensity is used in human communication.
Activity 2: Pitch Me a Curve
What the Teacher Does
Procedure Reference
Ring the small bell again and challenge the class to suggest Page 80
ways of making the bell sound at a higher pitch.
Part 1, Step 1
Ask the class to distinguish between loudness and pitch and Pages 80–81
relate their answers to the concept of sound waves.
Part 1, Steps 2 and 3
Have students log onto the Web site and click on the button Page 81
labeled “Lesson 3—Do You Hear What I Hear?”
Part 1,
Steps 4 and 5
= Involves copying
= Involves using
= Involves using
a master.
a transparency.
the Internet.
87
Student Lesson 3
How Your Brain Understands What Your Ear Hears
Have students collect data on the relative loudness of
Page 82
sounds using the loudness-pitch square and Master 3.3,
Part 1,
Loudness and Pitch.
Step 6–10
Have students answer questions on Master 3.3, Loudness Pages 82–83
and Pitch.
Part 1, Step 11
Have students collect data on a hearing-response curve
Pages 83–84
using Master 3.4, Hearing Response.
Part 2, Steps
1–3
Have students plot their data and answer the questions on Pages 84–85
Master 3.4, Hearing Response.
Part 2, Steps 4 and 5
Challenge students to describe how speech would sound
Page 85
with high pitches removed.
Part 3, Step 1
Have students return to the Web site and play unfiltered and Page 85
filtered sound tracks.
Part 3, Steps
2 and 3
Reconvene the class and discuss the following questions:
Pages 85–86
• Which sound track might simulate how an older person
Part 3, Step 4
with high-pitched hearing loss would hear the passage?
• Which sound track, filtered 4,000-Hz or filtered
2,000-Hz, is missing more pitches?
• How does loudness change as the higher pitches are
removed?
• How does your understanding of the words change as
the higher pitches are removed?
• How can a person compensate for high-pitched hearing
loss?
• What is the result of this compensation?
88
The Decibel Scale
Name_________________________________________
Date____________________________
Imagine hearing the softest sound that you can possibly hear. Then imagine that this sound is made louder and louder until it is so loud, it is physically painful to hear it. How much louder do you think the loudest sound would be compared with the softest?
You may be surprised to learn that a painfully loud sound would be more than 16,384 times as intense as the softest sound. In other words, your ears can hear a range of sounds that increase from a sound intensity of 1 unit to an intensity of 100 trillion units. To think of it another way, you began life as a single cell. But by the time you reach adulthood, you’ll be made of 100 trillion cells.
Because such an enormous range of numbers (from 1 to 100 trillion) can be difficult to work with, scientists have devised a special scale to use when measuring the intensity of sounds. This scale is called the decibel scale.
Study the patterns made by the numbers in the first two columns of the table on the next page. Then fill in the missing numbers in the columns labeled “Sound Intensity” and “Decibels (dB).”
Answer the questions below to learn more about the decibel scale.
1. How many times more intense is a sound of 30 dB than a sound of 20 dB? A sound of 40 dB
than a sound of 20 dB?
2. How many times more intense is the sound of an alarm clock than a quiet room?
Master 3.1
Sound-Intensity Table
Name_________________________________________
Date____________________________
Sound Intensity
Decibels (dB)
Sounds
1
0
just detectable
10
10
100
20
1,000
30
10,000
40
quiet room
normal conversation
alarm clock
rock concert (90–130 dB)
shout into ear at 20 cm
100,000,000,000,000
140
air raid siren
Master 3.2
Loudness and Pitch
Name_________________________________________
Date____________________________
Enter the results of your investigation of the relative loudness of sounds at different pitches (frequencies) as measured in hertz (Hz).
Frequency
62.5 125 250 500 1,000
2,000
4,000
8,000
11,000
(Hz)
Relative
loudness
Discussion Questions
1. Did the sounds produced at each frequency seem equally loud? How did the loudness change with frequency?
2. Why did you hear variation in loudness with changing pitch?
Master 3.3
Hearing Response
Name_________________________________________
Date____________________________
Frequency
62.5 125 250 500
1,000
2,000
4,000
8,000
11,000
(Hz)
Loudness
Value on
y-axis
Discussion Questions
1. At what frequencies is your hearing most sensitive? Circle these frequencies on your graph.
2. As we get older or are repeatedly exposed to loud sounds, we tend to lose hearing at higher frequencies. How might the hearing-response curve change for an individual with high-pitched hearing loss?
Master 3.4

Lesson 4
Elaborate
A Black Box Problem:
How Do I Hear?
Figure 4.1. Sound energy must be converted into a form that can be processed by the brain.
Overview
At a Glance
Students assemble a diagram of the hearing pathway using information about its parts and their functions, describe how sound is represented at various points along the pathway, and predict the changes in hearing that might result from specific changes to the pathway.
Major Concepts
The hearing pathway processes sound in a series of steps that involve different structures within the ear. Hearing requires the passage of vibrational energy from one medium to another, as well as its conversion to electrical energy in the form of nerve impulses. Transduction, which occurs in the cochlea, is the conversion of vibrational energy to electrical energy. Damage to specific parts of the hearing pathway results in predictable changes in hearing. The interpretation of what one hears occurs in the brain.
Objectives
After completing this lesson, students will
• be able to describe the structure and function of the major parts of the hearing pathway,
• understand that hearing requires the conversion of vibrational energy to electrical energy,
• be able to describe changes in hearing associated with specific changes to the hearing pathway, and
• understand how technology can be used to compensate for hearing loss.
93
How Your Brain Understands What Your Ear Hears
Teacher Background
Consult the following sections in Information about Hearing, Communication, and Understanding:
3.4 Perception of sound has a biological basis (pages 32–38) 4.6 Cochlear implants (pages 40–41)
In Advance
Web-Based Activities
Activity
Web Version?
1
Yes
2
No
Photocopies
Activity 1
Master 4.1, The Mysterious Black Box (Prepare an overhead transparency.)
Master 4.2, A Few Questio