In South Africa at present, about__________________ people between 15 and 59 are HIV
positive.
There are about ____________________AIDS orphans in our country.
Activity 2:
To make deductions from a graph
[LO 1.2]
Table 3.11.
If the life expectancy of a country’s inhabitants increases, it will be an indication of
progress. The life expectancy of the people of the Southern African Development
Community (SADC) has increased, as we can see in Figure 3.
Complete the horizontal column graph for the five SADC member countries according to
the information in Figure 5. Draw one column only, colouring it red for the expected age
with AIDS, and blue for the age that could have been reached without the AIDS catastrophe.
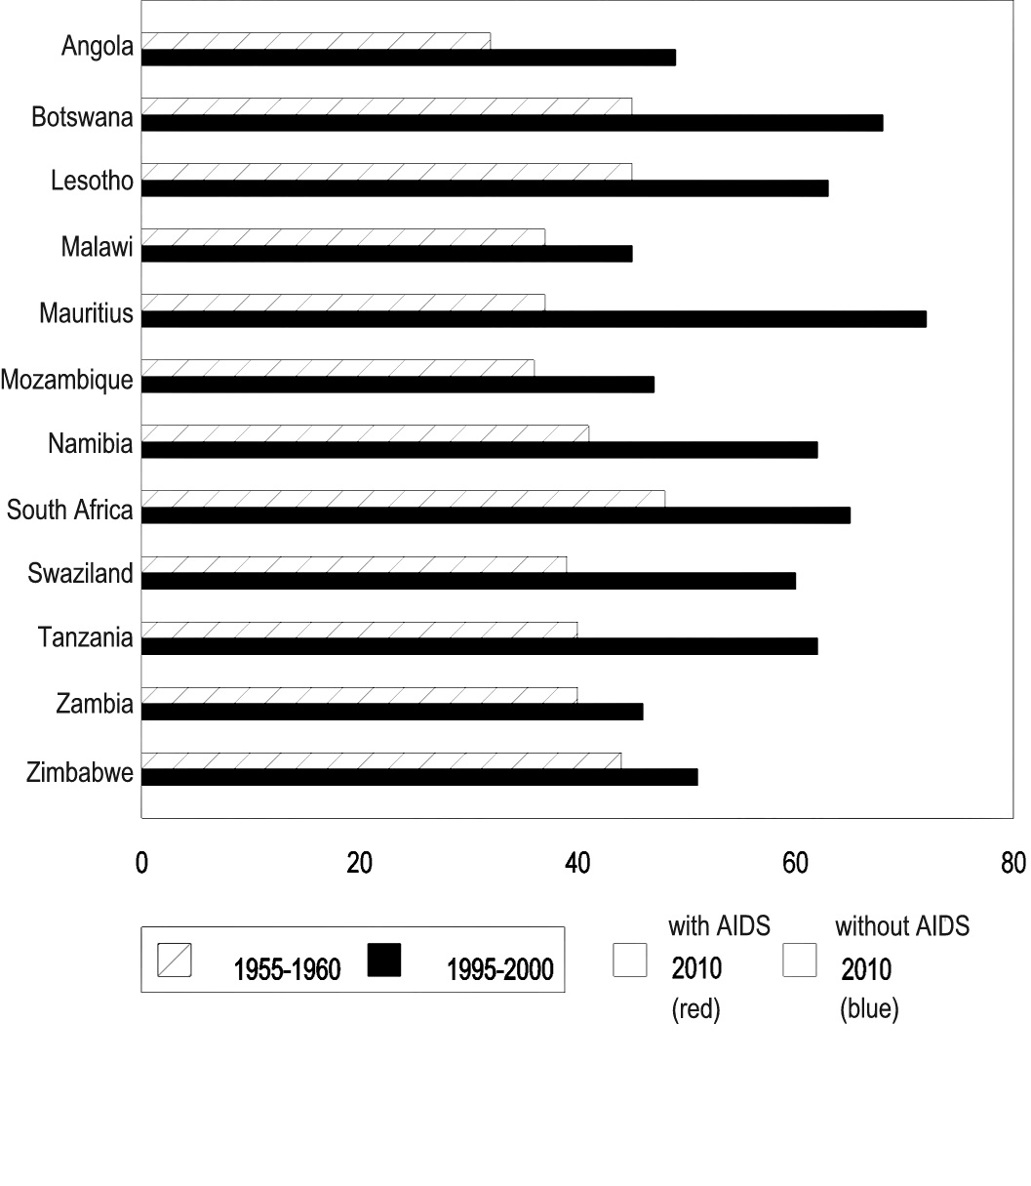
Figure 3.8.
Activity 3:
To make deductions from a graph
[LO 1.2]
The information in Figure 2 indicates a healthy reduction in the growth of the South African population. Death from AIDS may unfortunately reduce the growth to such an extent that it will have a negative effect on the country.
Researchers have predicted that the reduction between 2000 and 2010 without AIDS could be
1,7%, but that it could decrease to 1,5%, with AIDS. Complete the graph according to this
information. Use blue to indicate the growth without AIDS and red to indicate growth with
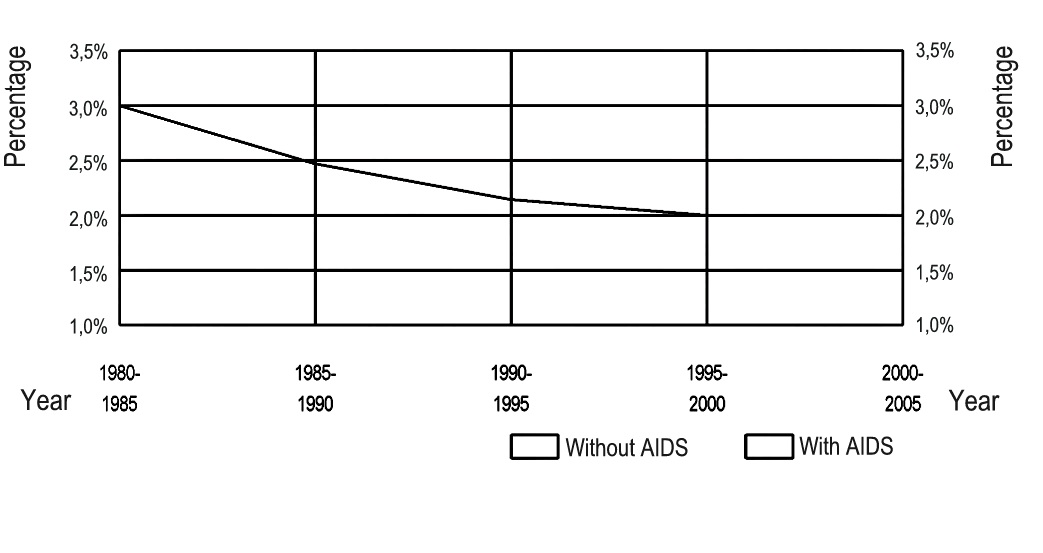
AIDS.
Figure 3.9.
Activity 4:
To make deductions from newspaper articles
[LO 1.5]
Collect newspaper articles dealing with this subject and display them on your notice board.
Articles indicating a solution for any problem relating to AIDS should be indicated in a
particular way. You can decide how.
Activity 5:
To make deductions from newspaper articles
[LO 1.5]
Read the newspaper articles dealing with the AIDS catastrophe that is staring our country in the face once again, think about it and discuss it with your friends. It ought to be clear that unless some plan to combat AIDS is devised soon, South Africa faces a major catastrophe.
Write a paragraph or two about the possible problems on a separate sheet of paper. Use the
following words and phrases:
Provide your paragraph with an appropriate heading.
Activity 6:
To make deductions from newspaper articles
[LO 1.5]
Near the end of the newspaper article someone is quoted as having said, “The solution of the problem begins with me.” Explain what you think this person meant in one sentence.
Activity 7:
To report on making adjustments in various areas
[LO 3.1]
Table 3.12.
The same truth is repeated four times in the frame alongside. In the light of the dangers for South Africa that are presented through AIDS, it is obvious that much adjustment is
necessary for survival.
Discuss the adjustments in the following areas that are required to meet the challenge and
report your ideas to the class:
1. the care of orphans;
2. the skilled workers in a factory become ill and fewer;
3. costs in the Department of Health double each year;
4. education.
Activity 8:
To explain the symbolism of the AIDS ribbon
[LO 1.5]
We see many people wearing red ribbons. Why do they do this?
Assessment
Table 3.13.
Learning Outcomes(LOs)
LO 1
GEOGRAPHICAL ENQUIRYThe learner will be able to use enquiry skills to investigate
geographical and environmental concepts and processes.
Assessment standards(ASe)
We know this when the learner:
1.2 organises and interprets information relevant to the enquiry from simple graphs, maps, and statistical sources [works with sources];
1.5 uses information to suggest answers, propose alternatives and possible solutions [answers the question];
1.6 reports on the inquiry using evidence from the sources including maps, diagrams and
graphics; where possible uses computers in the presentation [communicates the answer].
LO 3
EXPLORING ISSUESThe learner will be able to make informed decisions about social and
environmental issues and problems.
We know this when the learner:
3.1 identifies challenges to societies and settlements, with focus on population growth and
change [identifies the issue];
3.2 identifies the factors that contribute to population growth and change [factors affecting the issue];
3.3 identifies processes that affect population growth and change in various places [factors affecting the issue];
3.4 suggests ways of responding to issues associated with population growth and change in a
particular context [makes choices].
Memorandum
Activity 1:
These numbers change from year to year.
2002 4 000 000 HIV+ 380 000 AID orphans
2003 4 700 000 HIV+ 450 000 AID orphans and so on. . . . . . .
Answers will differ, depending on the learner’s ability to read/understand statistics.
Small differences do not matter. The aim of the exercise is to give the learner an idea of the extent of the problem – and to let them find out about it themselves.
Activity 2:
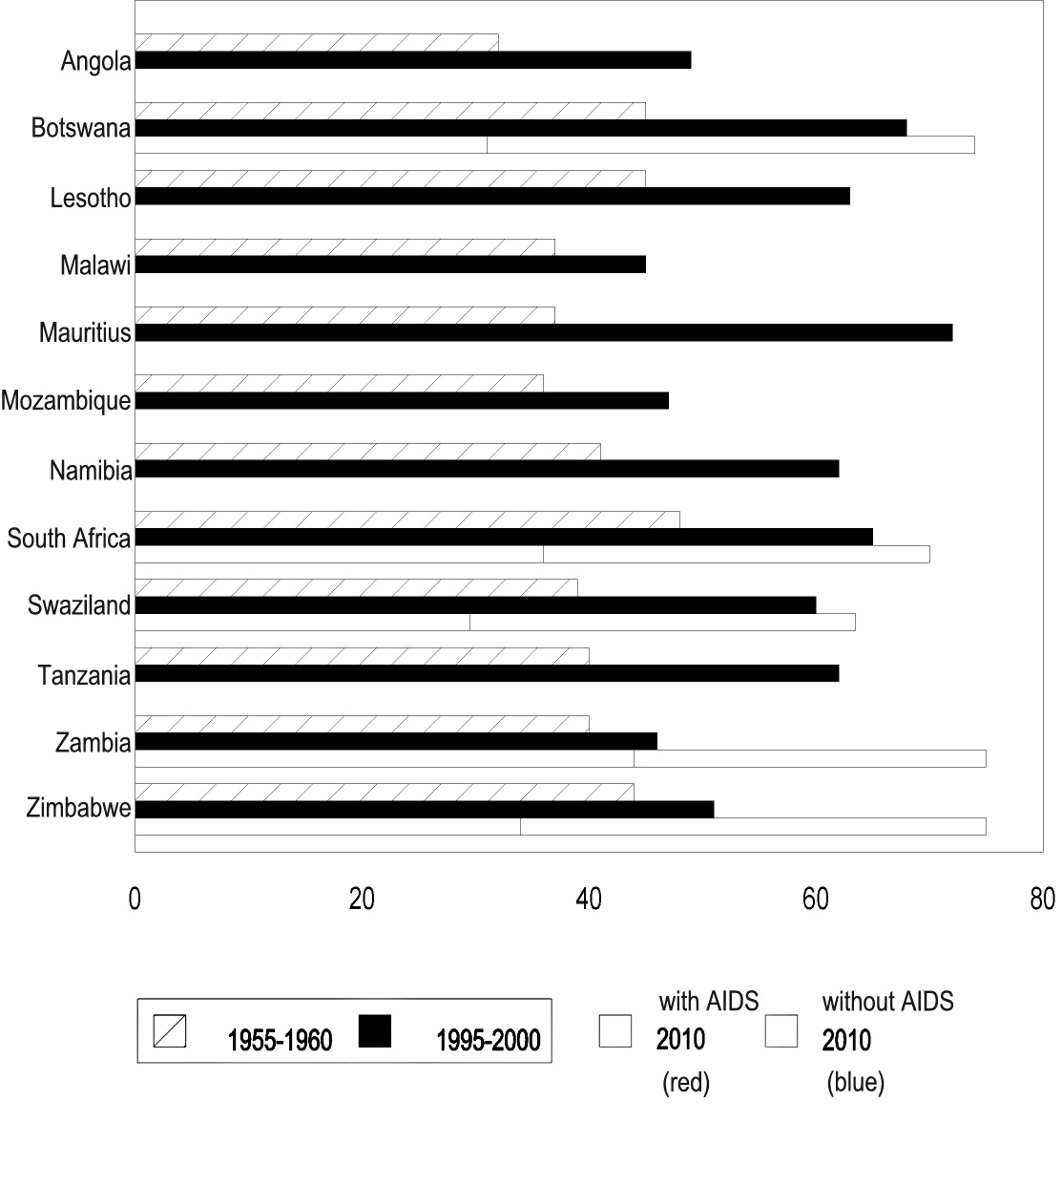
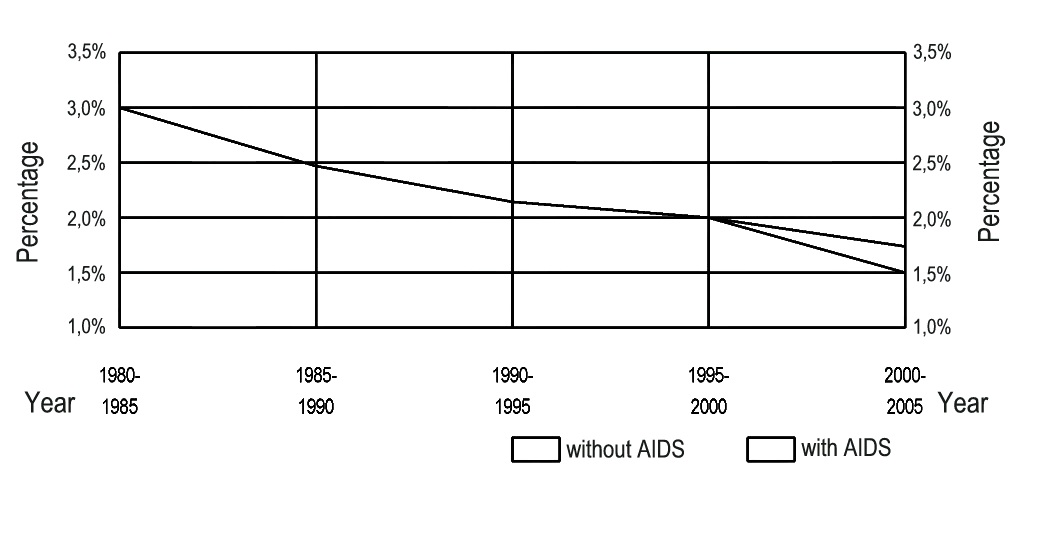
Figure 3.10.
Activity 3:
South Africa: Growth between 1980 and 2000
Figure 3.11.
Activity 4:
If it is at all possible, the ideal would be to emphasise the positive, especially if a creative approach to the solution of the problems of HIV/AIDS can be found
Activity 5:
The aim of Activity 6 is to see whether the learner can interpret the concepts in the context of the South African situation. Words can be used in any order.
The skilled workforce fishes and the factories will have problems with production.
The purchasing power is reduced because money must be spent on medical care for family
members.
When soldiers and policemen who are HIV positive become ill threats to the security of the
country and crime will increase because there will be fewer of them.
The care of millions of orphans is a heavy burden on the remaining family members and the state Activity 6:
Possibilities:
He/she must change their attitudes to the sickness/disease
She/he must do everything possible to resolve the problems
Activity 7:
1. A special policy, aimed at protecting children from the problems they will encounter, must be formulated.
New types of orphanages must be designed and built.
1. Greater mechanisation (But this will create other problems).
2. All departments will have to adjust their budgets to accommodate the extra expenditure on heath care.
3. People (adults and children) must be educated to limit the spread of the HIV virus, and also to manage the consequences of AIDS.
Activity 8:
People must be made aware of HIV/AIDS. It is a reality for all of us and not something that only affects other people.
Solutions
Chapter 4. Term 4
4.1. The reading, analysing and interpretation of
topographical maps*
SOCIAL SCIENCES: Geography
Grade 7
MAP WORK
Module 10
The reading, analysing and interpretation of topographic maps
The ability to use and interpret maps is an important part of a person’s geographical skills. When using a map you should remember that:
– the real picture on scale is reduced;
– the phenomena and patterns are seen as if shown from above, looking down on a landscape;
– symbols are used to show characteristics and phenomena.
Different kinds of maps are drawn for different functions.
Activity 1:
To identify a variety of maps as geographical and environmental resources
[LO 1.1]
See how many different kinds of maps you can identify in your atlas. Write down the names
underneath one another, and indicate each one’s most important function.
Activity 2:
To interpret maps containing a variety of information
[LO 1.2]
1. Different scales and calculating distance
You already know that a map is a REDUCTION of reality, as seen from above. To reduce a map in this way, you have to use a certain SCALE.
The scale of a map MUST be indicated at the bottom of a map. Different kinds of scales can be used:
On a line scale you can measure the distance between two places directly.
Ratio scale, e.g. 1:50 000 which means that 1 centimetre (or whatever length unit is used) on the map is equal to 50 000 centimetres (the same length unit) in reality.
If two places on the map are 4 cm away from each other, you will first have to make a calculation to determine the real distance, i.e.4 cm × 50 000 = 200 000 cm
= 200 000 cm ÷ 100 000
= 2 km
Word scale, e.g. 1 cm represents 20 km. If the distance between two places on the map is 3 cm, you will also have to do a calculation first:3 cm × 20 = 60 km
One of or all the different kinds of scales can be indicated on a specific map.
Activity 3:
To learn how to use line scale
[LO 1.3]
1. Measure the length and width of your classroom and then draw a floor plan. Use a scale of 2 cm to represent 1 metre.
Draw another floor plan of your classroom, but now use a scale of 1 cm to represent 1 metre.
2. The two drawings of the same classroom differ in size because there is a difference in the SCALES used for drawing them.
3. Measure something else at school that is quite a bit bigger than your classroom, for example the hall or the rugby field. Draw it on the same size paper that you used to draw your classroom. To be able to do this, you need to have more metres represented in a centimetre for your plan/map than was the case when you drew the classroom. The scale will therefore differ now because you have to draw a larger area on paper of the same size.
Indicate the scale as a line scale on your map.
Activity 4:
To calculate distance on an atlas map and a globe
[LO 1.3]
Open your atlas at a map of Southern Africa. Determine the real distance between the following places. Measure along a straight line (as the crow flies).
a) Cape Town – East London ___________km
b) Durban – Johannesburg __________________km
c) Pretoria – Kimberley _________________ km
d) Kimberley – Cape Town _________________ km
2. Determine the distances between the following places on a globe:
a) Durban and Sydney _______________ km
b) Cape Town and Rio de Janeiro _____________ km
c) Paris and New York ____________ km
d) Tokyo and Moscow_______ km
2. Map symbols and map keys
Included in this module is a 1:50 000 topographic map of Ceres, as well as a complete list of map symbols. These map symbols should be studied to enable you to identify the different
characteristics when you study the map of Ceres.
You need not necessarily do this exercise about Ceres. Ask your teacher to order a map of your own city or town and district in time to enable you to study your familiar surroundings as
indicated on the map. You’ll also be surprised at how much information it contains. Study the way in which mountains with different forms, mountain ravines, valleys, etc. are indicated.
WRITE TO: THE STATE PRINTER
PRIVATE BAG X85
PRETORIA
and order an official 1:50 000 map of the area in which your town or city is situated. You’ll be surprised at how little it costs.
Assessment
Table 4.1.
Learning Outcomes(LOs)
LO 1
GEOGRAPHICAL ENQUIRYThe learner will be able to use enquiry skills to investigate
geographical and environmental concepts and processes.
Assessment standards(ASe)
We know this when the learner:
1.1 identifies a variety of geographical and environmental sources relevant to an inquiry [finds sources];
1.2 organises and interprets information relevant to the enquiry from simple graphs, maps, and statistical sources [works with sources];
1.3 measures distances on globes atlases and maps using line scales [works with sources];
1.4 uses local maps and/or orthophoto maps to locate and investigate the issue and its context (compares with field observations) [works with sources];
1.5 uses information to suggest answers, propose alternatives and possible solutions [answers the question];
1.6 reports on the inquiry using evidence from the sources including maps, diagrams and
graphics; where possible uses computers in the presentation [communicates the answer].
Memorandum
Activity 1:
Table 4.2.
Kinds of maps
Function
Relief and drainage
Indicates mountains, rivers, etc.
Climatic regions
Indicates temperature, air-pressure, rainfall, etc.
Vegetation
Indicates typical vegetation
Population distribution Indicates distribution of people
Human activity
Indicates economic activities
Political
Indicates provinces and capital cities
Mineral resources
Indicates typical mining activities
Activity 4:
1. a) ± 925 km
± 500 km
± 500 km
± 840 km
2. Determine the distances between the following places on a globe:
a) Durban and Sydney 8 250 km
b) Cape Town and Rio de Janeiro 4 750 km
c) Paris and New York 5 250 km
d) Tokyo and Moscow 7 250 km
4.2. Reading, analysing and interpreting vertical aerial
photos and orthphoto maps*
SOCIAL SCIENCES: Geography
Grade 7
MAP WORK
Module 11
Reading, analysing and interpreting vertical aerial photos and
orthophoto maps
Before it can be expected of you to interpret vertical aerial photos and orthophoto’s any further, you will need more information.
A vertical aerial photo of a specific area is taken vertically from above from an aeroplane.
Advantages
Most objects are visible.
The layout of roads and railway tracks are clearly visible.
High trees, mountains and buildings can easily be distinguished by their shadows.
Disadvantages
The photos are as seen from above and the view is therefore odd to man. It is an unusual visual angle and one needs a lot of practice, knowledge and experience to read it.
It is in black and white and can be confusing.
Vertical aerial photos are used as the basis when topographic maps are drawn. Information from the aerial photos is transferred by cartographers (people trained to draw accurate maps) on paper by using the international symbol key and colours, which you are familiar with.
Today orthophoto maps are very popular in map studies. The advantages of the 1:50 000
topographic map and vertical aerial photo are combined to draw an orthophoto map. An
orthophoto map is therefore a vertical aerial photo on a lower level of 1:10 000, with contour lines added.
Contour lines of 5 metres intervals are used in order to identify detail. Even names of places, railway lines and roads are shown on the photo. The objects are therefore easily identifiable.
Maps and photos therefore have there own characteristics, advantages and disadvantages. A
clear presentation of a landscape is actually only possible when using a topographic map and photo together.
A topographic map is the presentation of the surface of an area on scale, using a symbol key.
This provides a simplified picture on which only certain characteristics are shown. A
topographic map is therefore not always accurate and can even be outdated.
A vertical aerial photo and orthophoto map are very useful tools when used together with a
topographic map. Only then accurate map and photo readings can be made.
1. How do you study or interpret a vertical aerial photo or orthophoto maps?
Size of objects
If the scale of the photo is calculated, then the length of objects can be determined and the distance and square area can be calculated. This method is used to determine the area of an urban settlement with a grid pattern.
Shapes of objects
Man made phenomena are generally evenly distributed. Here you can consider the shape of buildings, ploughed lands, roads, railway lines and dam walls. Natural phenomena and objects are evenly distributed, like mountains, rivers, forests, and grasslands.
Roads are broad grey lines on a photo. National roads are usually straight with no sharp curves.
Secondary roads appear narrower and have many curves. Railway lines appear as small dark
grey lines with gradual curves. Roads often have perpendicular connections with other roads, whereas railway lines gradually connect up with other lines.
Rivers are wide and dark grey lines with curves and bends where they meander through
different areas, and other side streams connect up with the main stream. The V-shape of a side stream connection will ALWAYS point down stream and can be used to determine the direction
of flow.
The tint and shading of objects
Black, white and grey tints can be seen on aerial pictures. The tint depends on the amount of light that is reflected by the photographed object. Light colours appear as light grey and dark colours as shades of darker grey.
The tint of water varies between white and black. Clear water appears darker than muddy water, because muddy water reflects more sunlight. Humid soil surfaces also appear darker than sandy soil.
Vegetation can be divided in two types according to their appearance on aerial photos: Natural vegetation like forests and grasslands is easy to identify due to their diverse pattern.
Trees usually have dark tints.
Planted trees and agricultural crops are also easily identified by the straight lines in which they are planted. The tint of a cultivated land depends on the height of the plants. For example, maize-fields with tall plants will appear darker than fields with small plants, because the tall plants absorb more sunlight than the small ones. Cultivated land usually has a patchwork quilt appearance of darker and lighter tints.
Gradients facing the sun reflect more light and therefore appear lighter than those with a southern gradient.
Texture of objects
It refers to the general impression that objects make and can be described as SMOOTH, FINE,
COURSE, ROUGH or DOTTED. Photos of cultivated land and water show a fine, smooth
appearance. Shrubs and forest vegetation has a dotted appearance, whereas uninhabited
mountainous areas have a rough appearance.
Shadows
Aerial photos are usually taken between 10:00 and 14:00 when shadows are at their shortest.
Shadows are of great help in identifying objects. Shadows that fall outwards indicate a higher area such as a hillside, mountain, or high building, whereas shadows falling inward indicate lower lying areas such as riverbeds and excavations.
Patterns
When analysing aerial photos, much information can be obtained from patterns. Certain patterns are characteristic of specific objects and phenomena. Bushveld vegetation has a diffused pattern, but citrus orchards or vineyards have linear patterns.
The arrangement of buildings and streets show a typical urban settlement pattern. The older, central business centre has a grid pattern, and the newer residential areas appear to have rather concentric patterns.
We therefore have two main pattern types that can be identified on an aerial photo:
the physical landscape, and
the cultural landscape.
Tips for reading, analysing and interpreting vertical aerial photos and orthophoto maps
Mark the general patterns that clearly appear on the photo. It is usually done by placing trace paper on the photo and then the profiles of the patterns are traced. The different characteristics are named.
Carefully study the shape, size, shadow, tint, and texture of the related characteristics to identify objects.
Ask certain kinds of questions that can assist in identifying objects:
Relief characteristics
Are there mountains, hills and valleys?
How steep are the slopes?
Are there any rivers?
How wide are the river valleys or plains?
In which direction does the river flow?
Is the river perennial or non-perennial?
Vegetation
Which types of vegetation exist?
Which areas are covered with natural vegetation?
Transport systems
Which types of transport occur?
Which types of roads criss-cross the photo?
Are the railway lines single or double lines?
Farming
Do they farm with livestock or is it crop farming? Or both?
What is the size of the cultivated land?
What kind of crops are grown?
Settlements
What types of buildings can be seen in the urban areas?
What is the layout of farmsteads and outbuildings?
Are there any industries? If so, which types?
Activity 1:
To identify and interpret information on a topographic and
orthophoto map of the known environment
[LO 1.4]
Your teacher will hand you a 1:50 000 topographic map and an orthophoto map of your area.
Try to apply all the knowledge that you gained from the previous pages by answering your
teacher’s questions.
Activity 2:
To identify a problem on an orthophoto map and to compare it with the real
situation
[LO 1.4, 1.5]
First work individually and then in your groups. Try to identify a problem that appears on the orthophoto map of your environment. If no problem exists, try to identify a potential problem, such as a flood, landslide, fires, erosion, the need for reservoirs, poor road or street planning, etc. Suggest a solution to the problem.
Activity 3:
To investigate an identified problem during a fieldwork excursion
and to write a report on it
[LO 1.6]
If possible your teacher will organise a fieldwork excursion to visit the site of such an
identified problem. Collect data by making use of maps, drawings, photos, etc. After the
excursion each group must write a report on their findings and also suggest a solution for the problem. The report must be written in the space below.
FIELD OBSERVATION
Position of site:
Problem:
Aids used in investigation:
Findings:
Suggested solution:
Names of group members:
Assessment
Table 4.3.
Learning Outcomes(LOs)
LO 1
GEOGRAPHICAL ENQUIRYThe learner will be able to use enquiry skills to investigate
geographical and environmental concepts and processes.
Assessment standards(ASe)
We know this when the learner:
1.1 identifies a variety of geographical and environmental sources relevant to an inquiry [finds sources];
1.2 organises and interprets information relevant to the enquiry from simple graphs, maps, and statistical sources [works with sources];
1.3 measures distances on globes atlases and maps using line scales [works with sources];
1.4 uses local maps and/or orthophoto maps to locate and investigate the issue and its context (compares with field observations) [works with sources];
1.5 uses information to suggest answers, propose alternatives and possible solutions [answers the question];
1.6 reports on the inquiry using evidence from the sources including maps, diagrams and
graphics; where possible uses computers in the presentation [communicates the answer].
4.3. Reading, analysing and interpreting vertical aerial
photos and orthphoto maps*
SOCIAL SC