15
1
70
7
7
75
22
14
75
6
9
75
5
9
80
8
14
80
3
4
80
4
18
85
3
4
85
13
4
85
2
11
90
22
10
90
7
8
90
9
3
95
5
16
95
9
19
95
19
15
100
14
17
100
1
2
100
16
6
Student 40
Age
Gene 1
Gene 2
5
23
5
10
8
2
15
17
8
20
11
12
25
15
11
30
20
1
35
9
5
40
15
8
45
6
19
50
6
1
55
16
22
60
21
12
65
22
21
70
10
23
75
16
11
80
23
12
85
24
15
90
10
24
95
6
9
100
16
15
Master 3.2g (page 7 of 7)
Copyright © 1999 by BSCS and Videodiscovery, Inc. Permission granted for classroom use. Updated 2012.
Collecting the Data
Cumulative Total
Cumulative Total
Number of People Number of People Number of People Number of People
Who Developed
Who Developed
Who Developed
Who Developed
Cancer:
Cancer:
Cancer:
Cancer:
Age
One Hit
Two Hit
One Hit
Two Hit
5 years
10 years
15 years
20 years
25 years
30 years
35 years
40 years
45 years
50 years
55 years
60 years
65 years
70 years
75 years
80 years
85 years
90 years
95 years
100 years
Master 3.3
Copyright © 1999 by BSCS and Videodiscovery, Inc. Permission granted for classroom use. Updated 2012.
Graphing the Data
Name: ___________________________
Graph the class’s results for the one-hit and two-hit hypotheses, then answer the question.
One-Hit
Two-Hit
100
100
90
90
80
80
70
70
s)
60
s)
60
year
50
year
50
e (
e (
ag
40
ag
40
30
30
20
20
10
10
0
0
0
5
10
15
20
25
30
0
5
10
15
20
25
30
number of people who developed cancer
number of people who developed cancer
Do the one-hit and two-hit hypotheses provide good explanations for the incidence of colon cancer?
Explain your answer.
Master 3.4
Copyright © 1999 by BSCS and Videodiscovery, Inc. Permission granted for classroom use. Updated 2012.
Using the Hit Simulator
Name: ___________________________
For classes with access to the Internet:
Follow the instructions below to use the online Hit Simulator to test hypotheses about the development of cancer (“Cancer as a Multistep Process” at http://science.education.nih.gov/
Conduct Your First Run
To familiarize yourself with the Hit Simulator, conduct a trial run:
1. Enter a “1” in Number of Hits. This value means that you are testing the hypothesis that only one mutation is required for cancer to develop.
2. Enter a “0.5” in Mutation Rate. This value means that you are testing the hypothesis that there is a 50 percent probability of experiencing a cancer-causing mutation at each age interval.
3. Click on “Calculate Next 5 Years.” The bar on the graph on the right side of the screen indicates the percentage of people in a population who would be expected to develop cancer by the age of 5
if the mutation rate was 50 percent and only one hit was required for a cell to become cancerous.
4. Click on “Calculate to Age 100.” The bars that appear on the graph indicate the percentage of people at each age interval who would be expected to develop cancer if the mutation
rate was 50 percent and it required only one hit for a cell to become cancerous.
For classes without access to the Internet:
Use the graphs on Master 3.6, Print-Outs from the Hit Simulator, to investigate the questions on the next two pages. Record your observations in the Table.
Investigate the Effect of Changing the Number of Hits Required
Use the online Hit Simulator or Master 3.6 (graphs 1 to 3) to investigate how the incidence of cancer in a population would be expected to change if different numbers of hits were required for a cell to become cancerous. For this investigation, keep the mutation rate set at 0.5 (50 percent). Conduct the runs indicated, then conduct three of your choice. Record your results in Table 1. All students complete rows 1 to 3. Students using the online simulator can select more hits and record data on rows 4 to 6.
Master 3.5a (page 1 of 3)
Copyright © 1999 by BSCS and Videodiscovery, Inc. Permission granted for classroom use. Updated 2012.
Table 1. Effect of Changing the Number of Hits Required
Percentage of People
Percentage of People
Percentage of People
Expected to Develop
Expected to Develop
Expected to Develop
Number of Hits
Mutation Rate
Cancer by Age 25
Cancer by Age 50
Cancer by Age 75
1
0.5
2
0.5
5
0.5
0.5
0.5
0.5
1. How does the incidence of cancer change as you require a greater number of hits for a cell to become cancerous?
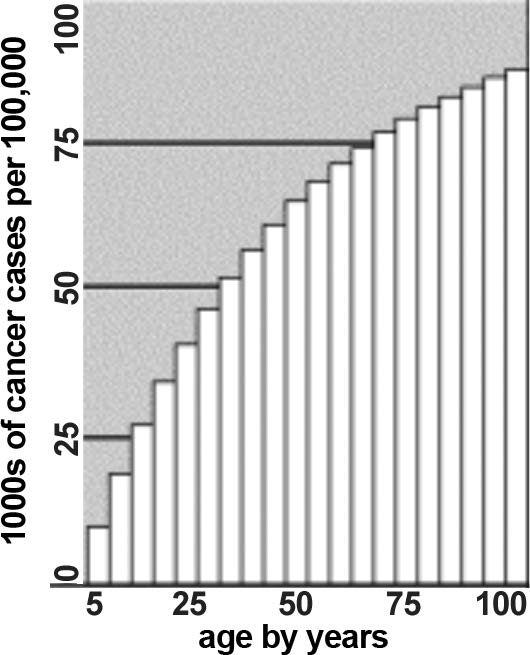
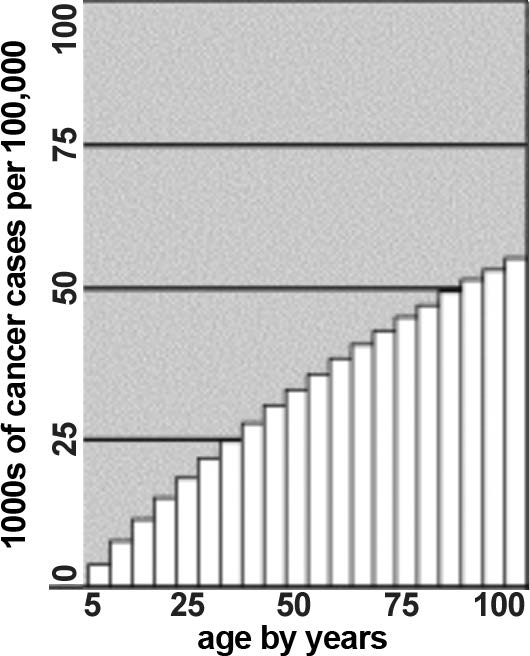
2. Recall the graph of the incidence of colon cancer that you observed at the beginning of this lesson.
Did the incidence of cancer in any of the runs you just completed match the incidence of cancer recorded in that graph? Explain your answer.
3. What can you conclude from this observation?
Investigate the Effect of Changing the Mutation Rate
Use the Hit Simulator (or Master 3.6, graphs 4, 5, and 6) to investigate how the incidence of cancer in a population would be expected to change if the mutation rate were different. For this investigation, keep the number of hits required set at 1. Conduct the runs indicated, then, if you’re working online, conduct three of your choice. Record your results in Table 2. All students complete rows 1 to 3. Students using the online simulator can select more hits and record data on rows 4 to 6.
Table 2. Effect of Changing the Mutation Rate
Percentage of People
Percentage of People
Percentage of People
Expected to Develop
Expected to Develop
Expected to Develop
Number of Hits
Mutation Rate
Cancer by Age 25
Cancer by Age 50
Cancer by Age 75
1
0.1
1
0.5
1
1.0
1
1
1
4. How does the incidence of cancer change as the mutation rate increases?
Master 3.5b (page 2 of 3)
Copyright © 1999 by BSCS and Videodiscovery, Inc. Permission granted for classroom use. Updated 2012.
5. Recall the graph of the incidence of colon cancer that you observed at the beginning of this lesson.
Did the incidence of cancer in any of the runs you just completed match the incidence of cancer recorded in that graph? Explain your answer.
6. What can you conclude from this observation?
Investigate the Effect of Changing Both the Number of Hits Required and the Mutation Rate Now use the Hit Simulator (or Master 3.6, graphs 7–12) to investigate how the incidence of cancer in a population would be expected to change with different combinations of the number of hits required and mutation rates. Conduct the runs indicated, then, if you’re working online, conduct three of your choice.
Record your results in Table 3. All students complete rows 1 to 3. Students using the online simulator can select more hits and record data on rows 4 to 6.
Table 3. Effect of Changing Both the Number of Hits Required and the
Mutation Rate
Percentage of People
Percentage of People
Percentage of People
Expected to Develop
Expected to Develop
Expected to Develop
Number of Hits
Mutation Rate
Cancer by Age 25
Cancer by Age 50
Cancer by Age 75
1
0.1
5
0.1
7
0.1
1
0.04
5
0.04
7
0.04
7. What can you conclude from your observations?
Summary
8. What clue did the change in risk of colon cancer give scientists about the cause of cancer?
Master 3.5c (page 3 of 3)
Copyright © 1999 by BSCS and Videodiscovery, Inc. Permission granted for classroom use. Updated 2012.
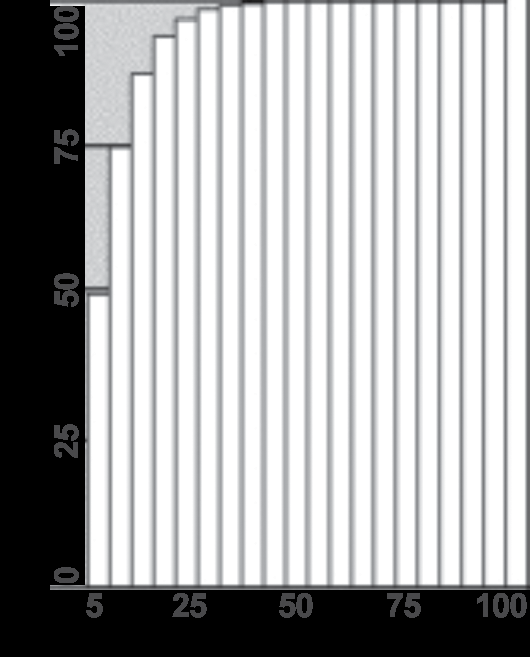
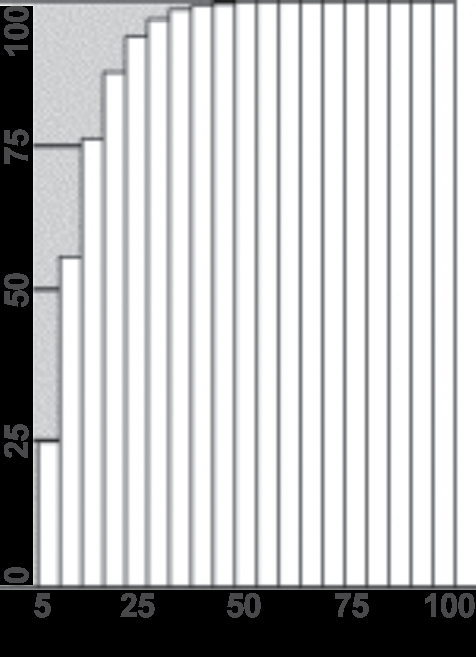
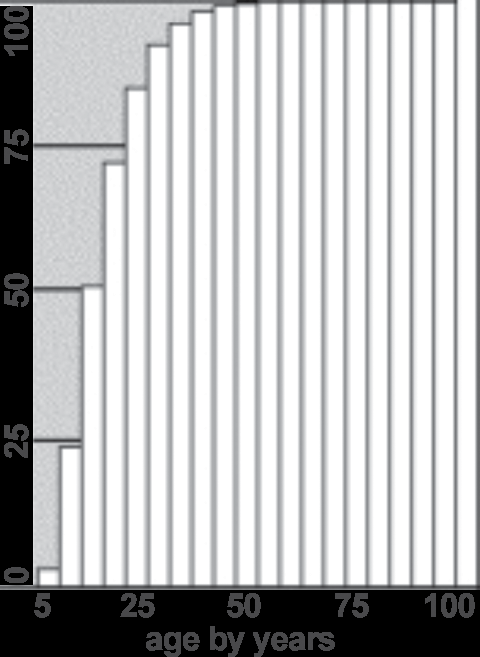
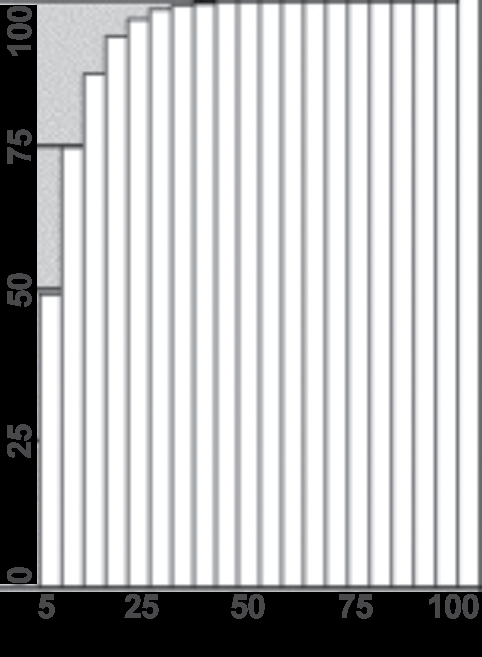
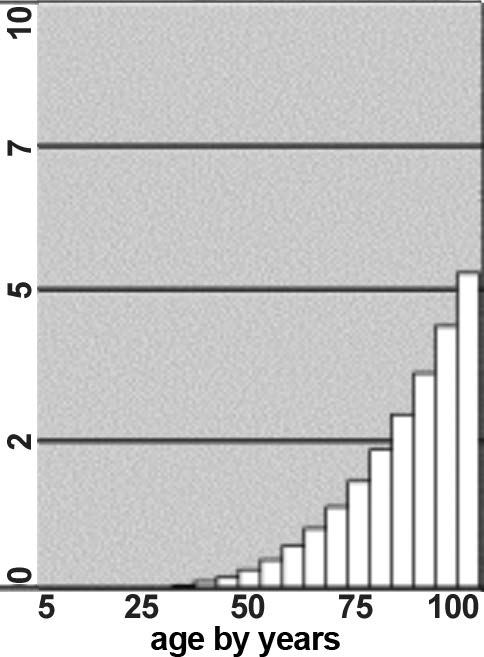
Print-Outs from the Hit Simulator
Use the following results from the online hit simulator to help you test hypotheses about the development of cancer.
1
2
3
Hits = 1; mutation rate = 0.5
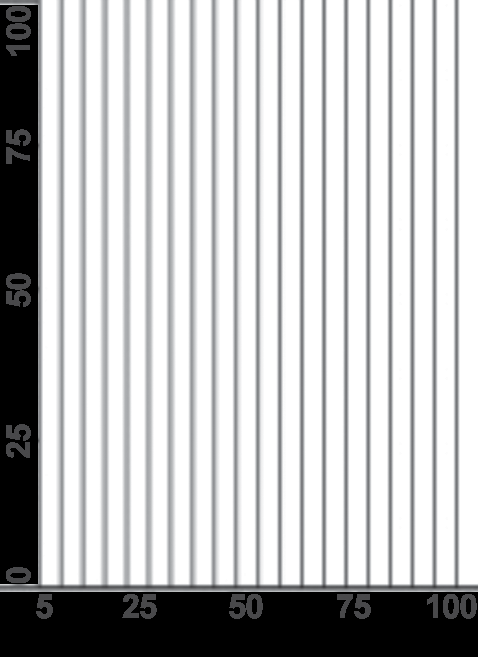
Hits = 2; mutation rate = 0.5
Hits = 5; mutation rate = 0.5
4
5
6
Hits = 1; mutation rate = 0.1
Hits = 1; mutation rate = 0.5
Hits = 1; mutation rate = 1
Master 3.6a (page 1 of 2)
Copyright © 1999 by BSCS and Videodiscovery, Inc. Permission granted for classroom use. Updated 2012.

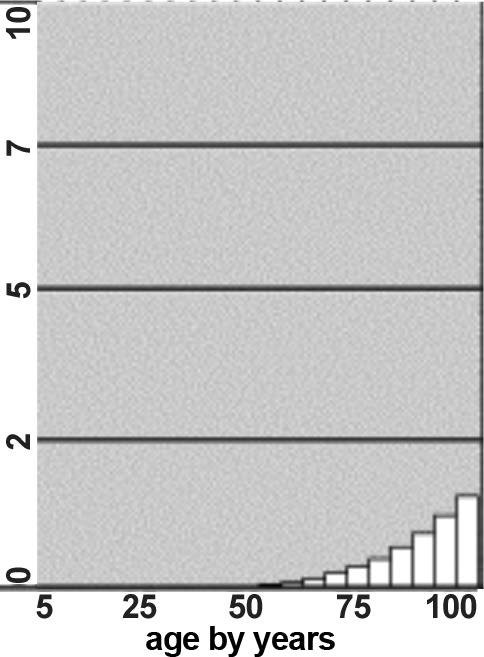
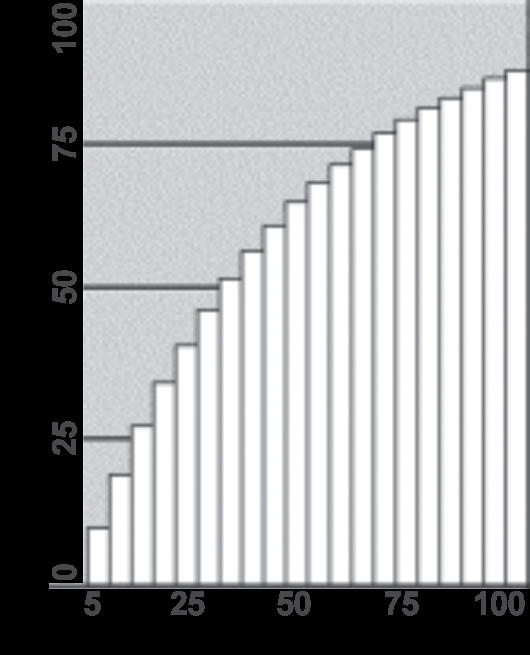
Print-Outs from the Hit Simulator
Use the following results from the online hit simulator to help you test hypotheses about the development of cancer.
7
8
9
Hits = 1; mutation rate = 0.1
Hits = 5; mutation rate = 0.1
Hits = 7; mutation rate = 0.1
10
11
12
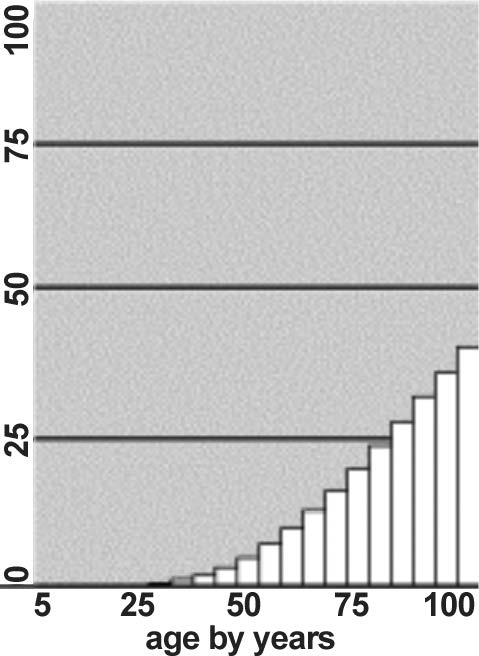
Hits = 1; mutation rate = 0.04 Hits = 5; mutation rate = 0.04 Hits = 7; mutation rate = 0.04
(Note changed Y=axis scale)
(Note changed Y-axis scale)
Master 3.6b (page 2 of 2)
Copyright © 1999 by BSCS and Videodiscovery, Inc. Permission granted for classroom use. Updated 2012.
Testing an Explanation by
Looking at Additional Data
Name: ___________________________
It sometimes happens that as scientists begin to explain one thing (for example, cancer as a multistep process), they find that they can also explain other observations. In fact, an idea’s power to help us explain other things we’ve observed gives us new evidence that the idea may be correct.
Use your new understanding of cancer as a multistep process to explain the following observations.
1. Cancer is a disease of aging. “With a handful of exceptions, cancer is a disease of aging and is vastly more likely to strike in the middle or later years than in childhood, youth, or young adulthood.
Indeed, experts unanimously cite age as the single most important risk factor [for cancer].” (1) Explanation:
2. You’ve come a long way, baby. “[There was a] 20–25-year lag between the onset of widespread cigarette smoking among women after World War II [1945] and the massive increase in female lung cancer detected in the 1970s.” (2)
Explanation:
3. Genes and increased susceptibility. “If a woman carries this mutation [ BRCA1], she faces . . . an
[increased] risk—not a certainty—of developing breast cancer. . . . If a woman does not carry this mutation, her risk of breast cancer is . . . [lower].” (3)
Explanation:
Sources:
1. Murphy, G.P., Morris, L.B., and Lange, D. 1997. Informed Decisions. Viking Penguin: The American Cancer Society.
2. Varmus, H., and Weinberg, R.A. 1993. Genes and the Biology of Cancer. New York: Scientific American Library.
3. Sidransky, D. 1996. Advances in cancer detection. Scientific American, 275(3): 104–109.
Master 3.7
Copyright © 1999 by BSCS and Videodiscovery, Inc. Permission granted for classroom use. Updated 2012.
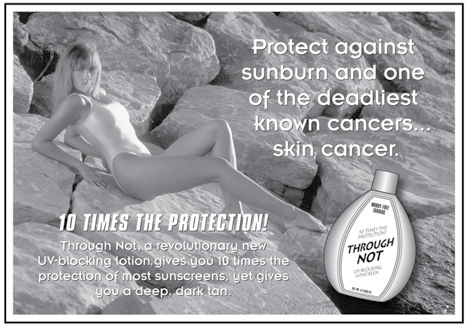
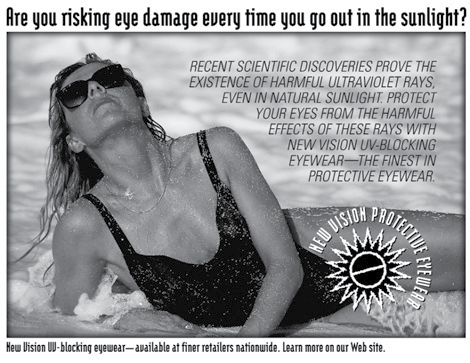
Media Item 1
Work with your groupmates to review this media item. First, identify the claims the item makes about the product, ultraviolet light, and cancer. Then, describe the evidence on which these claims are based.
Skin cancer is not one of the deadliest—the five-year survival rate is 91 percent.
Master 4.1
Copyright © 1999 by BSCS and Videodiscovery, Inc. Permission granted for classroom use. Updated 2012.
Media Item 2
Work with your groupmates to review this media item. First, identify the claims the item makes about the product, ultraviolet light, and cancer. Then, describe the evidence on which these claims are based.
Master 4.2
Copyright © 1999 by BSCS and Videodiscovery, Inc. Permission granted for classroom use. Updated 2012.

Media Item 3
Work with your groupmates to review this media item. First, identify the claims the item makes about the product, ultraviolet light, and cancer. Then, describe the evidence on which these claims are based.
Master 4.3
Copyright © 1999 by BSCS and Videodiscovery, Inc. Permission granted for classroom use. Updated 2012.

Media Item 4
Work with your groupmates to review this media item. First, identify the claims the item makes about the product, ultraviolet light, and cancer. Then, describe the evidence on which these claims are based.
Master 4.4
Copyright © 1999 by BSCS and Videodiscovery, Inc. Permission granted for classroom use. Updated 2012.
Using a Model System to Test Claims about UV Light
Name: ___________________________
You and your groupmates will use yeast as a model system for testing a claim your media item made about a particular product and UV light. Follow the steps below to design and conduct a controlled experiment that tests such a claim.
Learn about UV Light and Yeast
1. Read the following paragraphs to learn about ultraviolet (UV) light and the yeast you will use to test claims about UV light.
What is UV light?
UV light is one of the forms of radiation that is produced by the sun and by a variety of other sources (for example, certain types of artificial lights). UV light is not visible to us, but it is all around us.
It is the part of sunlight that causes sunburns and tans. It is also the part of sunlight that can cause skin cancer.
Why is UV light dangerous?
UV light can damage the DNA inside cells. Cells repair most of this damage, but occasionally a cell makes a mistake during this repair process. This mistake causes a mutation in one of the cell’s genes. The accumulation of mutations inside skin cells can lead to skin cancer.
What are yeast?
Yeast—in this case, baker’s yeast (scientific name, Saccharomyces cerevisiae)—are a simple, single-celled form of fungus. Yeast reproduce both sexually and asexually and have simple nutritional needs. You need a microscope to see a single yeast cell. But that cell can grow into a whole colony of cells (that you can just barely see) in one day if it is provided with the right conditions.
Why are yeast a good organism for testing claims about UV light?
Yeast are easy to grow in the laboratory. The type of yeast that you will use is especially sensitive to UV light. It cannot repair the damage that UV light causes to its DNA. Thus, these yeast are killed by sunlight. As you will see, you can use these UV-sensitive yeast to measure the killing effect of sunlight under different conditions.
Human skin cells (as well as normal yeast cells and most other normal cells) have enzymes that repair damage to DNA that is caused by UV light. But when too much damage occurs (as might occur, for example, when a person spends a great deal of time outdoors), the repair enzymes may not be able to keep up. Across time, mutations may accumulate inside skin cells, leading to cancer. UV-sensitive yeast are a good model for testing products claimed to protect a person from skin cancer because the yeast’s sensitivity allows the damaging effects of UV light to be observed very quickly.
Master 4.5a (page 1 of 4)
Copyright © 1999 by BSCS and Videodiscovery, Inc. Permission granted for classroom use. Updated 2012.
Write a Hypothesis
2. Write the claim you would like to test about UV light. Be sure that your claim is related in some way to your media item. An example of a claim about UV light is that the higher the altitude on the earth’s surface, the greater the amount of UV light present.
3. Now write the claim that you want to test in the form of a question. If you want to test the claim that more UV light reaches the earth’s surface at higher altitudes than at lower altitudes, you might ask, “Does more UV light reach the earth’s surface at higher altitudes than at lower altitudes?”
4. Write a tentative answer to your question. Scientists call such tentative answers “hypotheses.”
Your hypothesis about UV light and altitude might read, “Yes, more UV light reaches the earth’s surface at higher altitudes than at lower altitudes.”
5. Use your hypothesis to write a prediction. A prediction is a sentence that describes something that would happen if your hypothesis is correct. For example, your prediction about UV light and altitude might read, “If the amount of UV light that reaches the earth’s surface increases with increasing altitude, then the maximum at altitude X will be greater than the maximum at altitude Y.”
Design an Experiment
6. Describe the major parts of your experiment.
• What are your variables? That is, what will you change? What else might change? In the UV
light and altitude experiment, you would need to change the altitude at which you measure the UV light coming from the sun. The amount of UV light might also change as a result of the difference in altitude.
•