Skewed and Balanced Response Options
How you should scale the responses on a relationship survey? What scale is the best one to use in a customer satisfaction survey?
Most research academics that I’ve met use a seven point scale, with the balance or neutral point in the middle position (4).
If you use a ten point scale you will find that a) it isn’t balanced and b) there will be a tendency to group the results – 9 & 10, 7 & 8, 5 & 6 and so on – when the results are being analysed afterwards.
What do we mean by “balanced”? The scale should have as many negative options as positive options. Having a scale that reads Excellent, Good, Fair and Poor is not balanced; it is what is known as “front-end loaded” with three positive options and only one negative option. Psychologically respondents are subliminally prodded toward a more positive answer.
Where an alpha scale is employed, a “C” is usually seen as “average”, just like it was in school. On a numeric scale, the yardstick for “average” will usually be based on a percentage; 80% being considered middle of the road, and anything below 60% considered a failing grade. Yet, companies will look at a survey score derived from a 10-point numeric scale and conclude that an average of 5 (or 50%) is “middle of the pack”. In reality, they are probably looking at a measurement that indicates abject failure.
Think back to surveys you have seen over the years and consider the metric, or response options that were employed. Remember seeing surveys with an alpha scale (Please rank the following from A to F, with A being the best ……. ) or a numeric scale (Please rank from 1-10, with 10 being…. .)? Both are commonly used but flawed approaches in which respondents tend to be subliminally driven, their responses influenced by their experience with school grading systems.
Other scales may use various labelled derivatives – Good, Fair, Bad, Poor for example, or Meets Expectations, Does Not Meet Expectations, and so on. The problem there, of course, is that none of those carry a precise definition, so how can they be expected to produce a precise set of responses or lead anyone to a precise set of conclusions?
A metric can also be impacted by cultural and language issues. We once saw a global survey where the top box metric was “Very Satisfied”, followed by “Satisfied”. Looking at the reports, the company was troubled to see that responses from Japan lagged behind other areas in Asia. It was only after considerable teeth-gnashing and hand-wringing that someone did some research and found out there was a language problem. In Japan, when you had a modifier to something, you diminish its value. That is to say, “Satisfied” is the best possible response; by adding “Very” to it, a lesser degree of satisfaction was suggested.
Totally Satisfied vs. Very Satisfied
……Debates have raged over the scales used to depict levels of customer satisfaction. In recent years, however, studies have definitively proven that a “totally satisfied” customer is between 3 and 10 times more likely to initiate a repurchase, and that measuring this “top-box” category is significantly more precise than any other means. Moreover, surveys which measure percentages of “totally satisfied” customers instead of the traditional sum of “very satisfied” and “somewhat satisfied,” provide a much more accurate indicator of business growth.
Other Scale issues? There are other rules of thumb that may be used to ensure more valuable results:
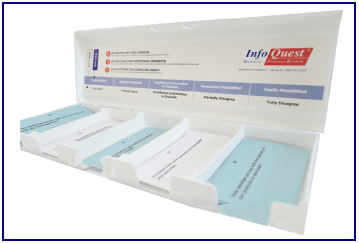
With our scale the response alternatives are balanced – Totally Satisfied, Somewhat Satisfied, Somewhat Dissatisfied and Totally Dissatisfied.
A fifth alternative, No Reply, or Insufficient Information to Evaluate, provides a catch-all for uncertainty, but does not encourage any specific reply.
“Totally Satisfied” - Defined
What does ‘Totally Satisfied’ mean in a customer satisfaction survey?
There are many ways to “score” or “scale” a survey. How the scale is devised and how the resulting responses are analysed and interpreted can have a dramatic impact on how surveys are responded to and how the results are used.
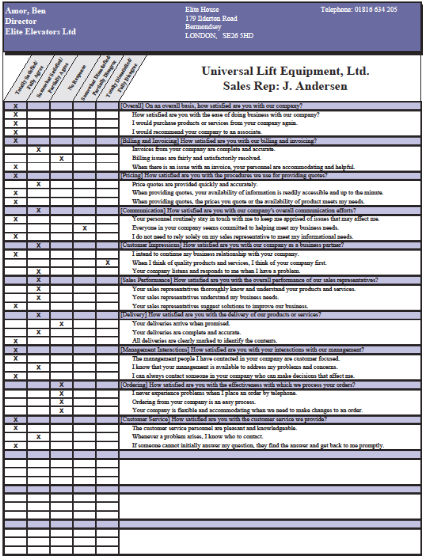
One example of a badly designed survey is the “front end loaded” scale, as in the picture on the left. This is offering you a choice between excellent, very good, good, fair and poor.
In the series above there are four positive responses and one negative response. The scale is “front end loaded” in that there are more “good” responses than “bad” ones.
The subliminal message the scale delivers is that the sender of the survey presumes there won’t be that many negative replies. The subconscious mind gets the message and responds accordingly.
“Totally Satisfied” is unambiguous
With our scale the response alternatives are balanced –
Totally Satisfied,
Somewhat Satisfied,
Somewhat Dissatisfied and
A fifth alternative, No Reply, or Insufficient Information to Evaluate, provides a catch-all for uncertainty, but does not encourage any specific reply.
The importance of using “Totally Satisfied” is simple. Those who are only “Somewhat Satisfied” will generally check out the competition – shop around for alternatives – before deciding whether or not they will come back to you. Those who are “Dissatisfied” are probably lost customers.
Totally Satisfied customers are, by and large, loyal.