The Stock Market vs. The Forex Market
The differences between the stock market and the forex market are significant. In this chapter, I will discuss the general definitions of the two as well as the pros and cons of each.
What is the Stock Market?
The definition of the stock market is simply the business of buying and selling stock for the financial aspect. Stock refers to a supply of money that a company has raised. Investors (or stock holders) give the company this supply of money in order to help that company grow, therefore increasing the value of their stock and in turn making a profit. The stock market is one of the more traditional ways to create a profit from an Investment even without having much knowledge about it. A person with little or no experience can make a few bucks without much research with traditional investments, such as stocks, bonds and blue chips. With thousands of companies to choose from it can be quite overwhelming and you never know when a company will go bankrupt or fold altogether. There can be a lot of risk and uncertainty when going after large gains in short amounts of time. It can be difficult to develop a system that can provide a consistent 10 to 15% profit on a yearly basis. The stock market is country specific, and deals only in business and currencies within that region. There are set business hours that typically follow the more traditional business day, and is closed on Holidays and weekends.
The Definition of the Forex Market
The forex market, also known as the foreign exchange or the (FX) market, is the place where currencies are traded. It is the largest, most liquid market in the world with an average traded value of over $5.3 trillion per day and includes all of the currencies in the World. Compare that to the $25 billion per day that the New York Stock Exchange trades and you can easily see how enormous the forex market really is. It actually equates to more than 3 times the total amount of stocks and futures markets combined. Forex is awesome! What exactly is traded on the forex market you ask? The simple answer is money. It is the simultaneous buying of one currency and the selling of another. Currencies are traded through a broker and are always traded in pairs.
EXAMPLE: The euro and the US dollar (EUR/USD)
-OR-
The British Pound and the Japanese Yen (GBP/JPY) Confused?
Think of it as buying a traditional 'share' in a particular country. Let's say you buy British Pound; you are essentially buying a share in the British economy as the price of the GBP is a direct reflection of what the market thinks about not only the current, but future health of the British economy.
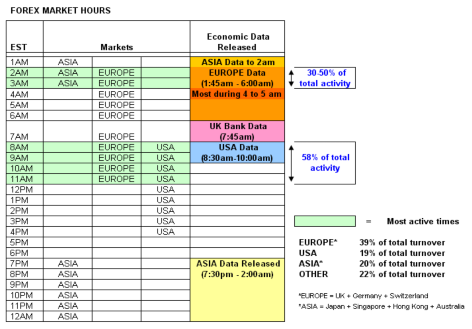
Market Hours
Unlike the traditional stock market, the forex market is open 24 hours a day. At any time, somewhere around the world, a financial center is open for business and is exchanging currencies every hour of the day and night. It follows the sun around the world, so you can trade late at night or early in the morning.
Keep in mind that these additional hours also add additional risk for us since we aren't able to monitor our investments 24 hours every day. There are several safety options, such as stop loss orders or limit orders that we will discuss later.
Forex Trading In Multiple Currencies
One of the most critical things that you must understand in forex trading is how to correctly determine the value of multiple currencies. Obviously not everyone will trade in US dollars but with so many variables, how can you tell a good buy or sell without complete understanding of the value of foreign currencies? Your first step is to figure out the current exchange rate between the currencies in question.
I highly recommend using this free currency table – FX Street.com. They are very reliable and have tons of information to help you as well. Aside from the information that I am giving you here, I highly recommend you study the materials available on their website as well. Keep in mind that these currency tables will not be consistently accurate down to the cent or fraction of a particular currency at all times throughout any day, but it will give you a solid starting point. Currency conversion is usually expressed in a ratio known as the cross rate. Normally you will see them listed in pairs in a xxx/yyy manner, with the xxx referred to as the 'base' currency (or home currency). The base currency is usually always listed as a whole number, while the converted currency will be expressed with a decimal that is as close as possible to the base rate.
EXAMPLE: 1 US dollar = 0.61484 British Pound
-OR-
1.000 USD/0.61484 GBP
You'll notice that the base currency is almost always in single units (such as one dollar instead of ten) and since the whole number (often referred to as the 'big' figure) of the secondary currency almost never changes, it is usually only referred to at the decimal point.
Also with the consolidation of most of the European market using the Euro, many currencies such as Franc or the Lira have been eliminated, making trading currencies much less complicated. It will take a bit of time, but once you get used to the base values of each currency, the changes will become more obvious to you, therefore making it easier and less confusing to monitor and you'll be making profitable trading decisions right along with the pros.
Trading Terms You Must Know
Now you most likely won't be standing amidst a few hundred other screaming stockbrokers on Wall Street, but it is important that you understand some of the terms that you would be hearing if you were. You want to be sure to understand what these terms mean in your trading. These are some of the most common trading terms:
General Concept
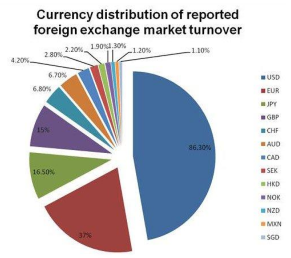
The forex market is by far the biggest and most popular financial market in the world. It is traded globally by individuals as well as banks and large organizations. The chart below shows the global foreign exchange activity, with the United States dollar (USD) being the most traded currency, with the Euro share at 2nd and the Japanese yen at 3rd.
The Nature of the Forex Market
The forex market is an over the counter market, which simply means that there is no central exchange or clearing house where orders are matched and transactions occur. Large commercial banks trade with each other through what's known as the Electronic Brokerage System (EBS). Such banks will only make their quotes available to other banks with which they trade. This market is not accessible to individual or retail traders. Then there are the online market makers. This is where individual traders can access the forex market through online market makers that primarily trade out of the US and the UK.
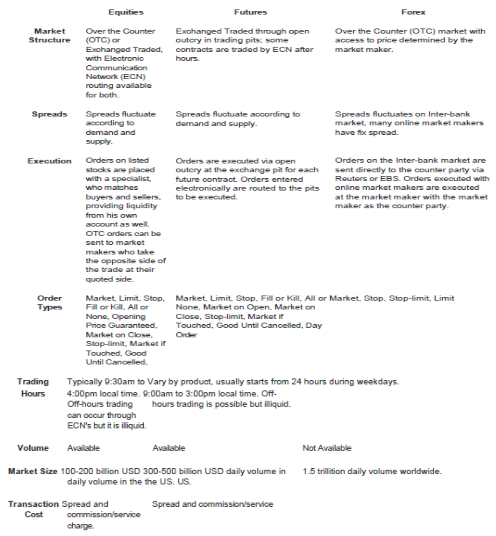
Financial Markets
Here is a simple comparison table of various financial markets and some of their basic features:
Forex: Past & Present
Until the late 1990's the forex market was really only available to the 'BIG Players'. You could basically only trade if you had a least $10 million to start with! It was originally intended to be used by bankers and large institutions- not by us 'little' guys. Because of the rise of the internet, online forex trading firms are now able to offer trading account to normal folks like us. Now all you need to trade in the forex market is a computer, a high speed internet connection and education.
What is a “Spread”?
We've already defined the spread to mean the difference between the bid price and the ask price, which constitutes the cost of the trade. In fact, all trades have spread stocks, futures, commodities, etc. Be aware that many online trading firms like to promote margin forex trading as virtually cost free - commission free, no service charge, no hidden cost, etc. The spread IS the cost of trading AND is also the main source of revenue for the trading firms. The spread may seem to be a small expense, but once you add up all the costs of all the trades, it can eat up your share of the profits pretty darn fast! On the other hand, while you want to find the tightest spread possible, anything that is far lower than typical is skeptical. Since the spread is the main source of revenue for the trading firm, if the firm doesn't earn enough from it there maybe some other hidden costs involved in the transaction.
Different Types of Orders
The following are some of the different types of orders available that can help you to protect yourself in your trading ventures. This isn't all that are available, but just some of the basic orders for you to make the most out of. Use them wisely!
How To Use Margins
A margin account allows customers to open positions with a higher value than the amount of funds they have deposited in their account. Also known as trading on a leveraged basis, most online firms offer up to 200 times leverage on a mini contract account. The forex market offers the highest leverage among other trading instruments with a margin requirement of 0.5% for open positions. The equity in excess of the margin requirement acts as a cushion for the trader. If a trader loses on a position to the point that the cushion runs out, then a margin call will result. The trader must then deposit more funds before the margin call or the position will be closed. The account will be 'margined out', meaning that all positions will be closed, once the equity falls below the margin requirement.
Most trading firms offer customizable leverage; traders can choose the leverage ratio that they feel most comfortable with. Be aware of how to guard against over trading an account and managing overall risk - we will cover that later on in this book.
Technical Analysis is the Name of the Game
Fundamental analysis and technical analysis are the two major approaches to analyzing and studying the currency market, the first focusing on the underlying causes of the price movements such as economic, social and political forces that drive supply and demand. Technical analysis focuses on the studies of the price movements themselves. I believe that the premise of technical analysis is that all current market information is already reflected in the price movement which is why we will focus on the latter. In the following chapter I will explain briefly the primary tools used for technical analysis, arming you with the knowledge of the professionals. Use this to compare notes and ideas, suggestions and advice with your trading firm.
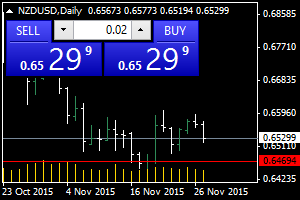
Using Charts
Charts are the most important tool in your understanding of the total sum of what is happening in the market. It is simply a visualized representation of the price movements a reflection of the psychology of the market and a visualization of the interaction between buyers and sellers, and shows how the market values a particular asset based on the information available. Because of this, it is considered to be an indispensible tool in the arsenal of any trader. There are 3 major charts: bar charts, candlestick charts and line charts. We will get into a bit more detail with the Candlestick charts a bit later, since they are the most commonly used charts amongst active traders.
1. Bar Charts - Bar charts provide traders with 4 key pieces of information for a given time frame:
Bar charts can be applied to all time frames and therefore, a single bar can summarize price activity over the past minute or the past month. A good rule of thumb is that the longer the time frame, the more significant it is since it will account for more data and will be a better reflection of the markets psychology.
2. Candlestick Charts –
Just like the bar chart, a candlestick chart contains the markets open, closing, low and high price points of a specific time frame. The main difference being that the candlesticks body will show the range between the opening price and the closing price during that particular time frame. Candlestick charts are more popular than the bar charts or line charts since they are more visually appealing and helps to identify more information. (see intro to candlestick for more information).
3. Line Charts –
These present much less information than the previous types of charts. They only show the closing price for a series of periods, therefore serve best to measure the overall direction of long-term trends. Line charts are of limited use for most traders but will show simply and clearly the direction of the trend which can be extremely useful.
Support & Resistance
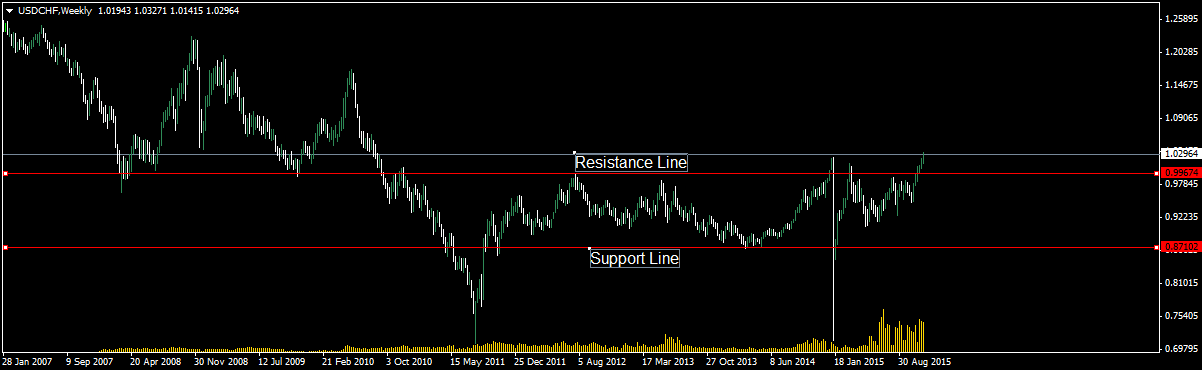
Support levels are prices where buyers have shown or are likely to show strength. Resistance levels are prices where sellers are likely to be strong. Support levels are basically giving the market a 'floor', since this is the area in which buyers tend to be strong. If the current price is at a strong support level, then traders can expect buyers to step in and drive the price up - or at least keep it from moving any lower. Resistance levels basically perform the exact opposite, and are essentially a 'ceiling' to the market. If the price is at or rises to a strong resistance level, then sellers in short term positions may enter the market while sellers in long positions may cover their positions to take their profits.
Many times when a price breaks through a resistance level, it will trigger a large number of stop orders and thereby greatly increases buying power. Be careful here though since not every breakout is valid. The same dangers of false breakouts apply to support levels as well.
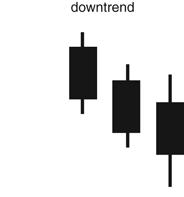
Identifying the Trends
A trend simply represents a general direction of a market. There is a physical law stating that an object in motion tends to continue in that motion until some extreme force causes it to change direction. Price trends are no different. A strong price trend will continue in it's current direction unless there is a price reversal indication, that will show up in your technical analysis - or even in fundamental analysis. There are 3 phases of major trends that you should be aware of in your analysis; Accumulation, public participation and distribution.
The accumulation phase is the first part of the trend which represents those who are well informed that will buy or sell. Meaning simply that if the well informed or more seasoned, experienced traders recognize that a current downward trend is coming to an end, then they would buy - and vice versa. The public participation is essentially when the masses would recognize the same and follow suit. The third and final phase - the distribution phase - occurs when everyone else catches on and public participation increases even further. It is at this point that the well informed, seasoned investors who accumulated during the accumulation phase would begin to sell, or vice versa.
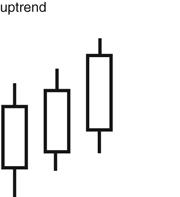
Highs & Lows
As a general rule of thumb, the existence of a trend depends on a series of highs and lows. 2 consecutive highs, each above the previous relative high and 2 relative lows above the previous low would constitute a tentative uptrend. A 3rd relative high would confirm that trend. It is very important to keep in mind that markets do not always move in trends!
They also spend a lot of time in 'ranges' fluctuating between already established highs and lows. A range bound market is often referred to as a 'sideways' market since it is neither moving in an upward trend or a downward trend. The price during a sideways market is often simply building support for a continued move in the original direction.
Drawing Trend Lines
Trend lines are drawn on historical price levels that show the general direction of where the market is heading and also provides indications of support or resistance. Drawing trend lines is a highly subjective matter, due to the fact that there are so many variables. How it works is this, in an uptrend a trend line should connect the relative low points on the chart. The line connecting the lows in a longer term position will be a support line that can provide a floor for partial retracements. The downtrend line that connects the relative highs on the chart will similarly act as resistance to shorter moves back higher. It is important to be flexible when drawing trend lines and redraw trend lines whenever necessary.
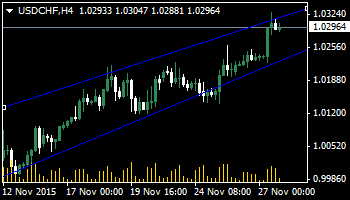
How to Use Price Channels?
In a trending market, a price channel can often be drawn between two parallel support and resistance levels. The key to this price channel is that the lines be drawn parallel to each other and the value of the price channel depends on that. Unlike trend lines, price channels should not be forced on a chart where they are not quickly apparent. How it works is this, once a trend line is established, draw a duplicate line parallel on the chart. Then move it up to the relative highs above or down to the relative lows below the trend line. If two or more fit with the line, then you may have located a valid price channel. Otherwise the market maybe too volatile - even in the middle of a strong trend, to plot a price channel.
Introduction to Candlesticks
Candlestick charts contain the markets open, closing, low and highs of a specific time frame. On a daily chart, each candle represents a 24-hour period and contains the information indicated above. On an hourly chart, each candle represents an hour and so on. But since the forex market never opens and closes, how can there be an open and closing price? To identify this information, the chart provider will decide on a time, say 5 PM EST, as the daily open and closing time. Keep in mind that different chart providers may have different opening and closing times and traders may notice that the charts may differ from different providers.
Chart Patterns & What They Mean To You
There are recurring patterns on these candlestick charts that can be observed by technical analysis. These patterns are like recurring pictures that tend to occur when a trend is starting or about to end, or even reverse its direction. They provide an excellent visualization of the price movements and can give us a good idea of what is happening in the market. These patterns are the best gage for identifying trends in the market.
EXAMPLE: If a candlestick is very short, it implies that the range for trading that day was very tight. If this candle appears after a strong uptrend, it may suggest that sellers are beginning to enter the market more aggressively and thus the price may be on its way back down. Eventually, with a bit of practice, these candlestick patterns can be easily used to identify potential trends in the market - especially when used in conjunction with other indicators, allowing you to enter the market with strong references to the patters. Here are some key patterns to watch out for:
Doji/Double Doji
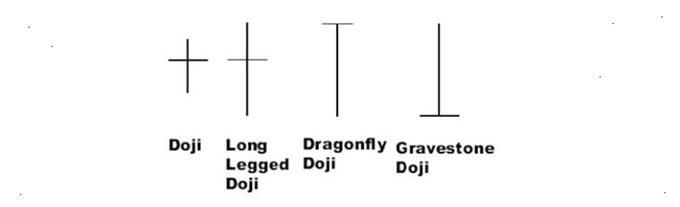
This pattern indicates indecision in the marketplace as the price has a big range but isn't going anywhere.
Hammer - Hanging Men
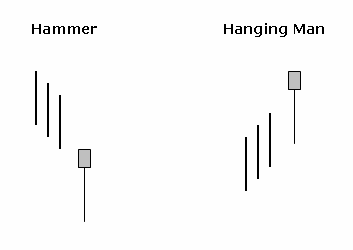
This is an indication of a good reversal pattern after a severe trend. It signifies a weakening market. Pattern is considered a hammer after a downtrend and a hanging man after an uptrend.
Evening Star
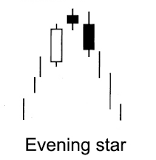
Reversal pattern shows trend has changed direction after making new highs.
Morning Star
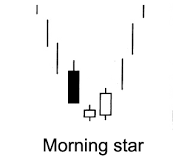
Opposite of the evening star - reversal pattern shows trend has changed direction after making new lows.
Bear Market
Common pattern after strong uptrends. Signifies that buyers are losing control.
Bull Market
Common pattern after dramatic downtrends. Signifies that downtrend has lost momentum.
Harami
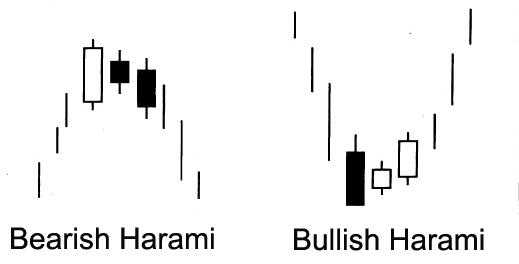
Harami shows a trend that is losing momentum and may reverse.
Shooting Star
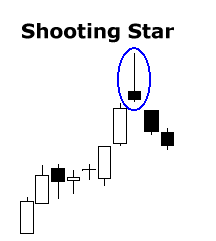
Reversal patterns that occur after gaps. Buyers may make new high but fail to sustain them.
Piercing Line
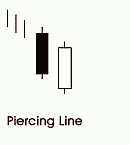
Bullish reversal patterns which shows sellers are losing their dominance.
Dark Cloud Cover
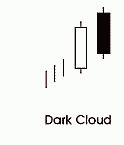
Bearish pattern showing slowing buyer momentum. Keep in mind that you will recognize these patterns as you gain more experience. These are just some of the patterns to watch out for.
Using Fibonacci Retracements
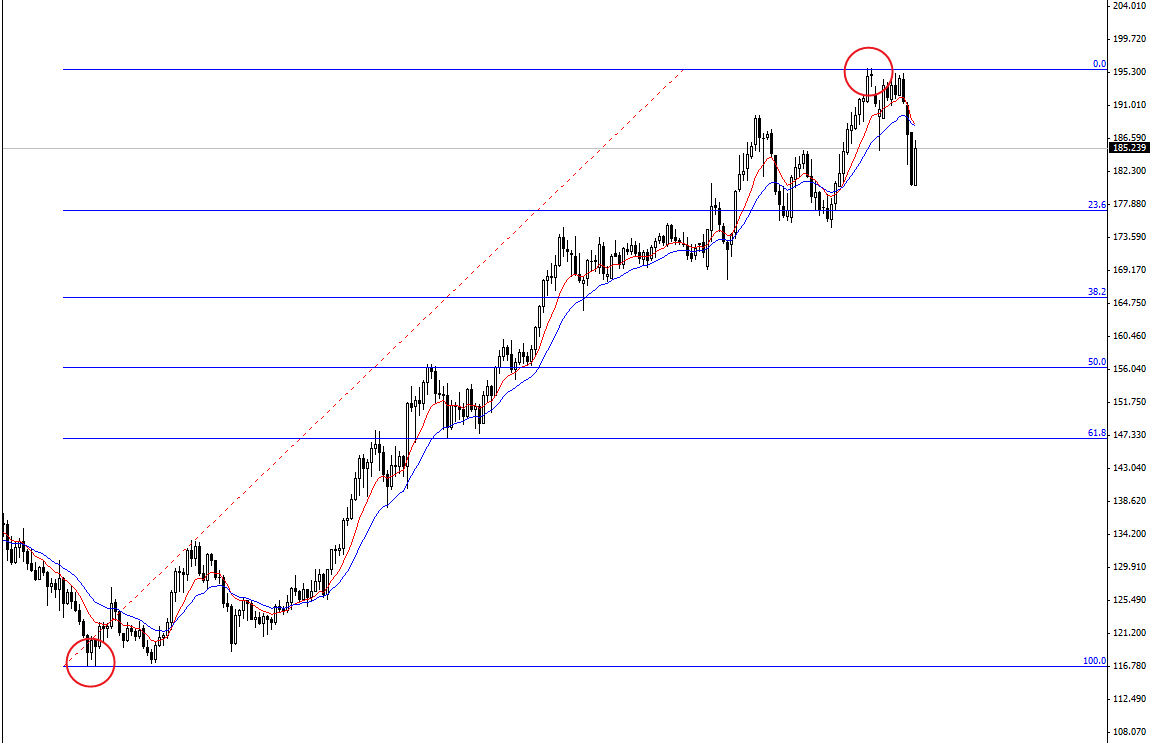
Fibonacci retracements are based on mathematical numbers that repeat themselves and attempt to measure the likely points that a currency pair will retrace, or pull back to within a range. Now while I'm not about to get into the mathematical system that is uses (Boring!) I will let you know that you can use a charting software with the Fibonacci function, or simply let your forex firm help with your charting. Also, note that Fibonacci retracements can be used in both bull (uptrend) and bear (downtrend) markets. You will need to look for retracement levels and use them with your candlestick patterns to confirm your trades.
<