Levels of Support and Resistance
Support and resistance levels are the price levels where the price action either stops or reverses itself.
Introduction:
Levels of support and resistance are one of the easiest concepts to understand in the context of both the forex markets and the stock markets.Support and resistance levels define the points where the laws of supply and demand lead the price action as buyers and sellers come into the forex market. The support and resistance levels are actually areas where supply and demand is not in balance.
When there are a large number of buyers who are in the market, there is high demand and a level of support is created in the market. Likewise, when a high number of sellers enter the market, there is high supply and a level of resistance is created which prevents the price moving higher.
The other half of the equation is volume. The higher the volume at these support and resistance levels the more important the signal is being given.
Levels of Support and Resistance:
There are many techniques for determining where the support and resistance levels are. The most popular ones are pivot points, Fibonacci levels, CCI, RSI and Stochastics.Perhaps the most popular of all is the use of Fibonacci levels and pivot points. The reason being is that because these techniques are used so widely they have almost become a self fulfilling prophecy.
With millions of traders watching the same charts and using the same technical analysis tools the support and resistance levels are almost set in stone and prices nearly always stop their current direction and reverse away from these levels.
Other traders especially day traders use whole numbers to identify support and resistance levels. Price that end in 0 or 00 are seen by day traders to be significant support or resistance levels.
The following charts respectively show support and resistance levels being identified using in the 1st chart Fibonacci levels, and in the second chart pivot points.
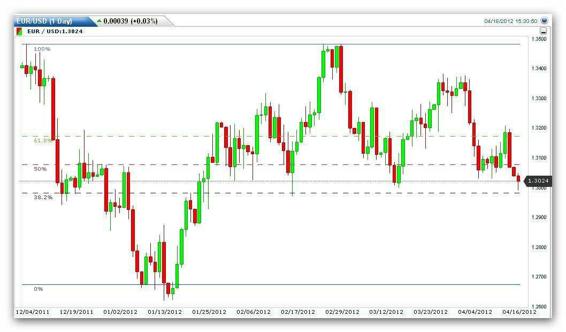
On the chart above clearly shows how the Fibonacci levels acted as support of resistance levels. The key levels are 38.2% and 50%. Notice how many times the price bounces off the support and resistance levels.
The next chart shows pivot points. The heavy blue line is the pivot point and as you can see it is acting as a strong resistance level for the upward surge of buying on the 16th April. The three blue lines below the pivot point are support levels and the three blue lines above the pivot point are the resistance levels.
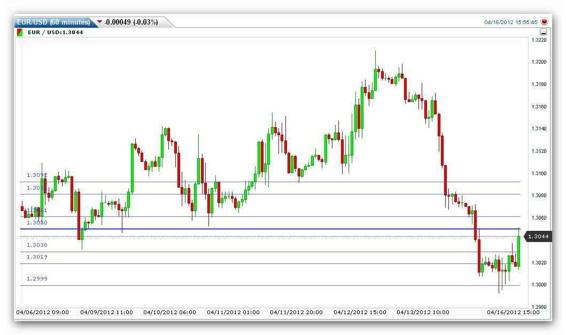
Notice how the final support level is the 1.3000 price which makes it an even stronger support level as the price ends in a double zero. Once this support level is breached it is highly likely that the price will lose another 100 pips very quickly.
Also notice how the resistance level immediately above the pivot point acted as a support level for several days. This phenomenon is quite commonplace where a resistant level becomes a support level and a support level becomes a resistant level.
Article source: etoro.com