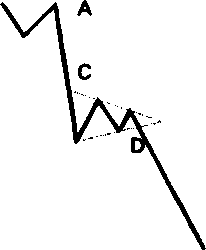
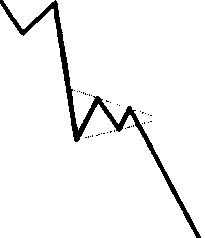
Figure 4.29. Diagrams of a bear flag formation.
Figure 4.30. Example of bullish flags in the Swiss franc chart.
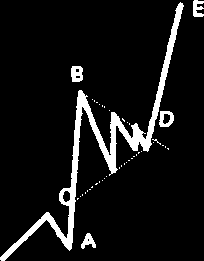
Pennants. The pennants are closely related to the flags, so the same principles apply. The sole difference is that the consolidation area better resembles a pennant, as the support and resistance lines converge. If the original trend is bullish, then the chart pattern is a bullish pennant. In Figure 4.31, the pennant pole is AВ. С, В, and D frame the pennant-shaped consolidation. When the market breaks
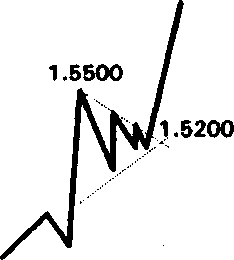
through the resistance line ВD, the price objective is E. The amplitude of the target price is D to E, and it is equal to the pennant pole A to B. The price target measurement starts from the breakout point. Outgoing from prices in Figure 4.31, the height of the pennant pole is measured as the difference 1.5500 - 1.4500 =
1.1000. Once the resistance line is broken at 1.5200, the price target is 1.5200 +1.1000 = 1.6200.
2001 by Royal Forex. All right reserved. www.royalforex.com
40