Figure 4.32. Diagrams of a bearish pennant.
2001 by Royal Forex. All right reserved. www.royalforex.com
41
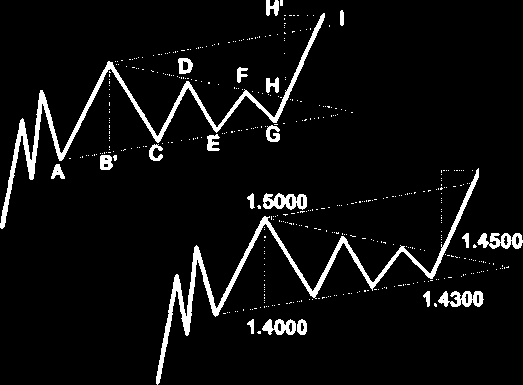
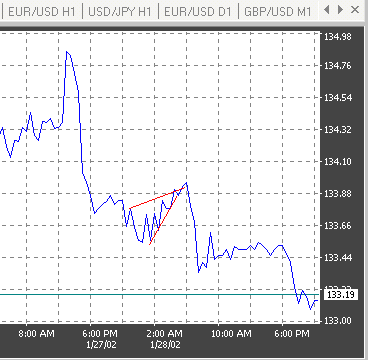
Figure 4.33. A real example of a bearish pennant in the Japanese yen chart.
Triangles. Triangles can be considered as pennants with no poles. There are four types of triangles: symmetrical, ascending, descending, and expanding (broadening.)
A symmetrical triangle consists of two symmetrically converging support and resistance lines,
defined by at least four significant points (See Figures 4.34 and 4.35). The two symmetrically converging lines suggest that there is a balance between supply and demand in the foreign exchange market.
Consequently, a break may occur on either side. Hence, in the case of a bullish symmetrical triangle, the breakout will likely occur in the same direction, qualifying the formation as a continuation pattern.
As Figure 4.34 shows, the converging lines are symmetrical. Points B, D, and F define the declining
line. Points A, C, E, and G define the rising support line. The price target is either equal to the width of the base of the triangle BB', measured from the breakout point H (HH'); or at the intersection of line BI (which is a parallel line to the rising line AG) with the price line. Trading volume will visibly decrease toward the end of the triangle, suggesting the ambivalence of the market. The breakout is accompanied by a rise in volume.
Outgoing from prices in Figure 4.34, the price objective is either 1.5500, as the difference 1.5000 -
1.4000 = 0.1000 added to 1.4500; or 1.5300, as the difference between 1.5000 - 1.4000 = 0.1000, added to 1.4300. A currency market example is presented in Figure 4.35.