Figure 4.34. Diagrams of a bullish symmetrical triangle.
2001 by Royal Forex. All right reserved. www.royalforex.com
42
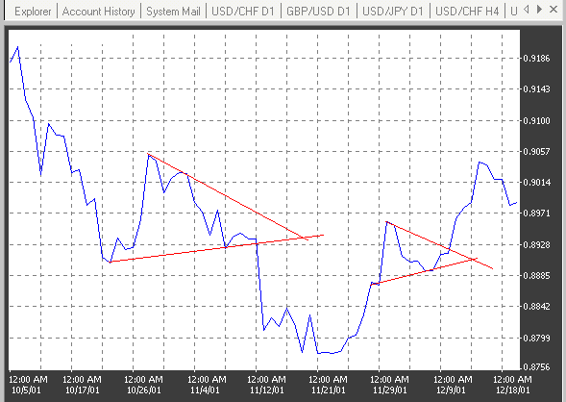
Figure 4.35. A real example of symmetrical triangles in the Euro chart.
From triangles of other kind the descending triangle is considered below. It consists of a flat
support line and a downward sloping resistance line (See Figure 4.36). This pattern suggests that supply is larger than demand. The currency is expected to break on the downside. The descending triangle also
provides a price objective. Measuring the width of the triangle base and then transposing it to the
breakpoint calculate this objective. As shown in Figure 4.36, the support line, defined by points A, C, E, and G, is flat. The converging top line, defined by points B, D, F, and H, is sloped downward. The price objective is the width of the base of the triangle ( AA'), measured above the support line from the breakout point I ( IF.)
Outgoing from prices on Figure 4.36, the price objective is 1.3000, as the difference 1.5000 -
1.4000 = 0.1000 subtracted from 1.4000.
Trading volume is decreasing steadily toward the tip of the triangle, but increases rapidly on the
breakout.
The expanding (broadening) triangle, or the megaphone consists of a horizontal mirror image of a triangle, where the tip of the triangle is next to the original trend, rather than its base (See Figure 4.37).
Volume also follows the horizontal mirror image switch and increases steadily as the chart formation
develops. As shown in Figure 4.37, the bottom support line, defined by points B, D, and F, and the top line, defined by points A, C, and E, are divergent. The price objective should be the width, GG', of the base of the triangle, measured from the breakout point G.
Outgoing from prices on Figure 4.37, the price objective is 102.00, as the difference between 101.00 -
100.00 = 1.00 subtracted from 101.00. A real example of the megaphone is shown in Figure 4.38.
2001 by Royal Forex. All right reserved. www.royalforex.com
43
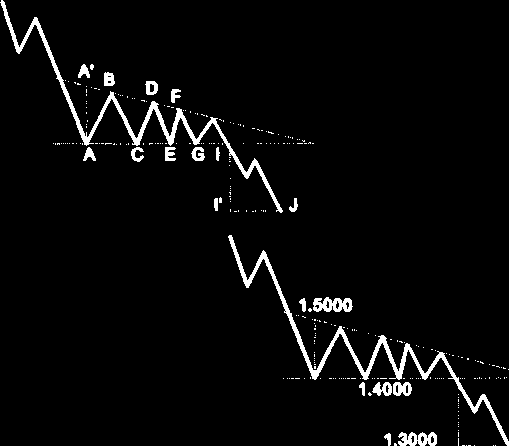
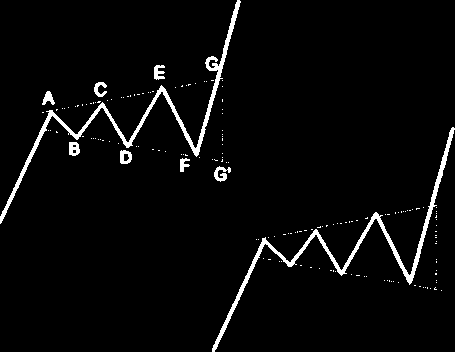
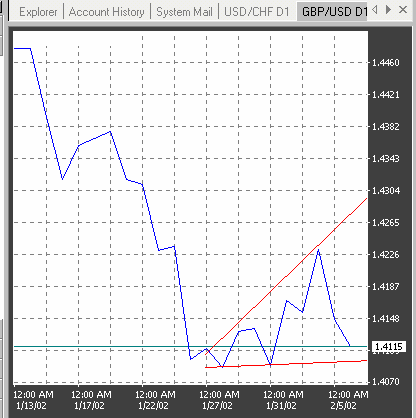
Figure 4.36. Diagrams of a descending triangle.