Figure 4.37. Diagrams of an expanding triangle.
Figure 4.38. A real example of megaphone formation in the Pound Sterling chart.
2001 by Royal Forex. All right reserved. www.royalforex.com
44
Wedges. The wedge formation is a close relative of the triangle and the pennant formations. It resembles both the shape and the development time of the triangles, but it really looks and behaves like a pennant without a pole. The wedge is markedly sloped, and the breakout occurs in the direction opposite to its slope (See Figures 4.39 and 4.40), but similar to the direction of the original trend. The signal we receive from the wedge formation is direction only. There is no reliable price objective. Depending on the trend direction, there are falling and rising types of wedges (as in Figure 4.39).
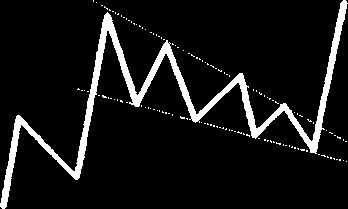
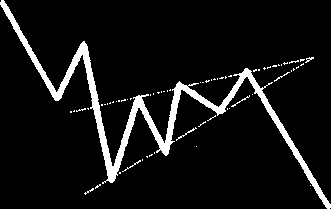
Figure 4.39. Diagrams of a falling (in a bullish trend) and a rising (in a bearish trend) wedges.
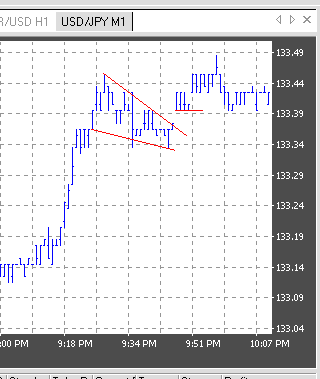
Figure 4.40. Example of a falling wedge in a bullish trend in the Japanese yen chart.
Rectangles . The rectangle formation reflects a consolidation period. Upon breakout, it is likely to continue the original trend. Its failure will change it from a continuation to a reversal pattern. This pattern is easy to spot, as it can be considered a minor side-ways trend.
If it occurs within an up-trend and the breakout occurs on the upside, it is called a bullish rectangle (See Figure 4.41). The price objective is the height of the rectangle. As Figure 5.56 shows, the currency moves between well-defined, flat support and resistance levels. A valid breakout may occur on either
side from this consolidation period. The price target (GH) is equal to the height of the rectangle (G'H),
2001 by Royal Forex. All right reserved. www.royalforex.com
45
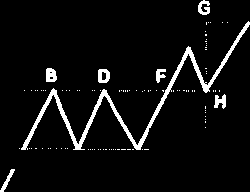
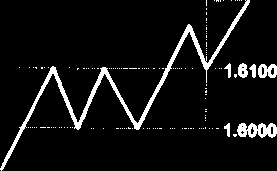
measured from the breakout point H. Outgoing from prices in Figure 4.41, the price objective is 1.6200, as difference 1.6100 - 1.6000 = 0.0100, added to 1.6100.
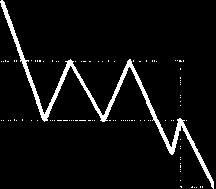
If the consolidation occurs within a downtrend and the breakout continues the original trend, then it is called a bearish rectangle (See Figure 4.42). As shown in Figure 4.42, the currency moves between
well-defined, flat support and resistance levels. A valid breakout may occur on either side of this
consolidation on period. The price objective (HG') is equal in size to the height of the rectangle (GH), measured from the breakout point H. In the numerical example, the price objective is 100.00 (difference 102.00 - 101.00 = 1.00, subtracted from 101.00).