The Elliott Waves Principle is a system of empirically derived rules about the amount of
ascending and descending waves during the history of a market movement. This theory postulates
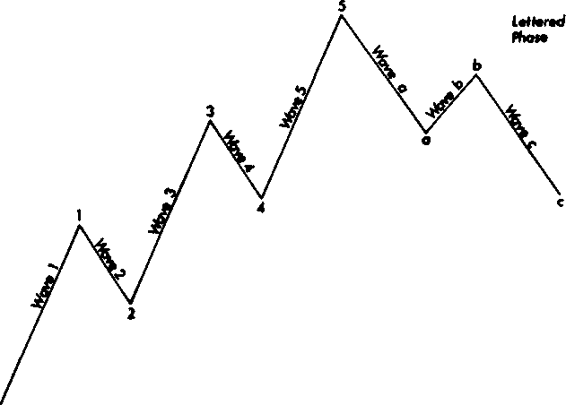
that all the market movement consists of cycles containing 8 waves each including five waves in the
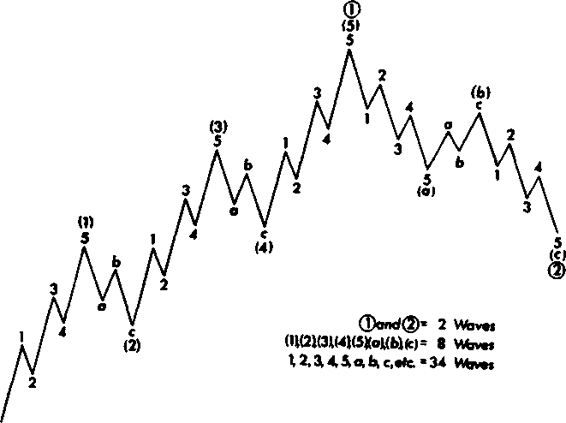
direction of the trend at one larger scale and three waves against that trend. In a rising market, this five wave/three-wave pattern forms one complete bull market/bear market cycle of eight waves. The five-wave upward movement as a whole is referred to as an impulse wave with sub waves labeled with figures while the three-wave countertrend movement is described as a corrective wave with sub waves labeled with letters (See Figure 5.1). Amplitudes of the correction waves subordinate certain rules: a second wave may never retrace more than 100 percent of a first wave (for example, in a bull market, the low of the second wave may not go below the beginning of the first wave); the third wave is never the shortest wave in an impulse sequence, often, it is the longest; a fourth wave can never enter the price range of a first wave (See Figure 5.2) As the illustration shows, waves of any degree in any series can be subdivided and
resubdivided into waves of smaller degree or expanded into waves of larger degree. Furthermore,
smaller-scale movements link up to create larger-scale movements possessing the same basic form.
Conversely, large-scale movements consist of smaller-scale subdivisions with which they share a
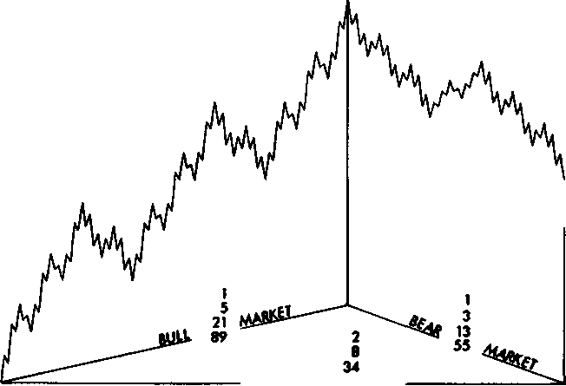
geometric similarity. Because these movements link up in increments of five waves and three waves, they generate sequences of numbers that the analyst can use (along with the rules of wave formation) to help identify the current state of pattern development, as shown in Figure 5.3.
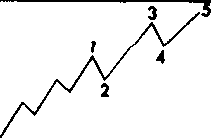
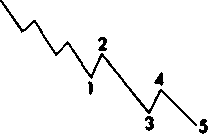
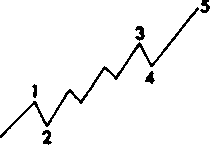
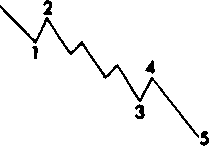
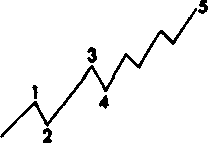
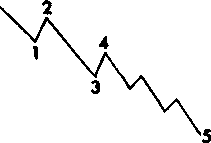
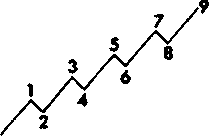
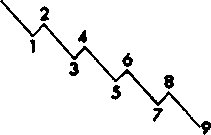
Extentions. In any given five-wave sequence, a tendency exists for one of the three impulse sub waves (i.e., wave 1, wave 3, or wave 5) to be an extension— an elongated movement, usually with internal subdivisions. At times, these subdivisions are of nearly the same amplitude and duration as the larger degree waves of the main impulse sequence, giving a total count of nine waves of similar size rather
than the normal count of five for the main sequence (See Figure 5.4). Extensions can provide a useful guide to the lengths of future waves. Most impulse sequences contain extensions in only one of their three
impulsive sub waves. Thus, if the first and third waves are of about the same magnitude, the fifth wave probably will be extended, especially if volume during the fifth wave is greater than during the third.
Diagonal Triangles. There are certain patterns resembling known from the technical analysis theory including two types of triangles, which are to be considered from the Elliott theory position.
The diagonal triangle type 1 occurs only in fifth waves and in С waves, and it signals that the preceding move has "gone too far, too fast," as Elliott put it. Essentially a rising wedge formation defined by two converging trend lines, type 1 diagonal triangles indicate exhaustion of the larger movement.
Unlike other impulse waves, all of the patterns' sub-waves, including waves 1, 3, and 5, consist of three-wave movements, and their fourth waves often enter the price range of their first waves, as shown in Figures 5.5 and 5.6. A rising diagonal triangle type 1 is bearish, because it is usually followed by a sharp
decline, at least to the level where the formation began. In contrast, a falling diagonal type 1 is bullish, because an upward thrust usually follows.
The diagonal triangle type 2 occurs even more rarely than type 1. This pattern, found in first-wave or A-wave positions in very rare cases, re sembles a diagonal type 1 in that it is defined by converging trend lines and its first wave and fourth wave overlap, as shown in Figure 5.7. However, it differs
significantly from type 1 in that its impulsive sub waves (waves 1, 3, and 5) are normal, five-wave impulse waves, in contrast to the three-wave sub waves of type 1. This is consistent with the message of the type 2
2001 by Royal Forex. All right reserved. www.royalforex.com
64
diagonal triangle, which signals continuation of the underlying trend, in contrast to the type 1 's message of termination of the larger trend.
Failures (Truncated Fifths). Elliott used the word failure to describe an impulse pattern in which the extreme of the fifth wave fails to exceed the extreme of the third wave. Figures 5.8 and 5.9 show examples of failures in bull and bear markets. As the illustrations show, the truncated fifth wave contains the necessary impulsive (i.e., five-wave) substructure to complete the larger movement. However, its
failure to surpass the previous impulse wave's extreme signals weakness in the underlying trend, and a sharp reversal usually follows.
Figure 5.1. Diagram of the basic Elliott Wave.
Figure 5.2. The larger scale pattern of the Elliott wave.
2001 by Royal Forex. All right reserved. www.royalforex.com
65
r scale pattern in detail.
Figure 5.3. Diagram of a complete market cycle.
BULL MARKET