8. Example of a Set-up
From the descriptions above, you will be aware that the 4x4 system is basically to find a trend, assess its suitability and then identify a particular set-up. There are a number of set-ups within the system that are specially designed to ensure consistency with the analysis. Here is one example that you can try. Remember that you must have first identified a suitable trend and that you only trade in the direction of the trend.
The BOSS points to where the best opportunities are: you then decide if you want to take them according to the rules of the set-ups. Based on the set-up being followed here, the analysis should proceed as follows:
The logic of this set-up is as follows:
Look at this analysis on the chart below. This is a 1 hour (60 minute) chart of the S&P500 Index at a time when there was a good uptrend on the daily and 4 hour charts (not shown here) price was within the Bollinger band on both.
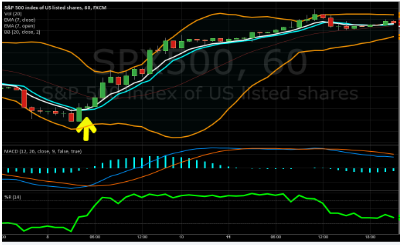
The top part of the chart shows the index using a candlestick chart. Look at the point above the yellow arrow. The 7 hour EMA of the close has just crossed above the 7 hour EMA of the open on the previous bar. That’s the signal. The MACD has turned up strongly and the Williams %R has crossed -50 and is rising. The conditions for the trade are all fulfilled. A trade taken at that point would have been a winner across all the relevant time periods.
Notice that the price levels out at about the middle of the chart – this is probably the night time period when markets are quieter – and the two EMAs approach each other although they don’t actually cross. They then begin to move apart again suggesting that another trade might be possible. However, look at the MACD. As price moves to a new high it is falling and the histogram is below the zero line. Similarly, the Williams %R reading is falling and is soon in the lower part of its chart i.e. below -50. There is a technical divergence and no trade is allowed using this set-up. If a trade had been taken it might have been a winner on a short time period, but it would have been loser over most periods. These are not good odds.
At the high, the index moved outside the Bollinger bands, indicating a reversal or a pause in the trend was likely. While not shown on this chart, the index actually remained flat or close to this level for the next two days, precisely the sort of trading conditions that would eat into profits. SO even though there was a good daily uptrend, unless the conditions of the set-up are filled no trade should be taken. This underlines the importance of this 2 stage type of analysis.
With a little practice you will soon find that a set-up such as this with written rules is easy to learn and apply. There is always some discretion, but consistency is achieved through rule based trading. Notice in particular that there is nothing complex here but you must undertake the analysis and have a way to record the results.