Chapter 19
Jeff's Cardinal Rules for Investing
Now we know how to use these databases, formats and reports. Now you will learn how to use them to find stocks that are worth buying. This database will help you narrow down the stocks to a manageable level. You will find several good online places, Yahoo Finance for one, where you can type in various criteria you're interested in to narrow the range of stocks you want to consider. It is outside the scope of this book to go into great detail into that but if you hunt around on Google and just do searches for stock financial planning help or something like that I'm sure you can find several sources and again I mentioned ways to search for stocks in my newsletter when I give you my favorite website of the week to help you be a better investor. I have several references to places to search somewhere in my previous monthly newsletter sent if you're really interested in it just e-mail me and I will try and find you a couple of good places to look for stocks. Again my e-mail is jeffee13@hotmail.com
First reread Chapter 8 of this book, to refresh your memory on how to select the right stocks. I'll hit some important points again. First if you're serious about investing, get a subscription to Barron’s – it's better than ever because now along with your weekly paper subscription you get an online subscription, can't beat that. It's the best source of information I found on good stocks to consider to buy. Every issue will show you many good stocks to consider – from various articles, from the Winners and Losers page in the back of the data section showing you what stocks fell the most that we, or from reviewing the stock tables themselves. Reading Barron’s will quickly make you a knowledgeable investor. And you can check one out at your local library to see if you like it.
Below are my cardinal rules for picking stocks that they will explain later in this chapter.
The Cardinal Rules for Investing
1. Thou shalt only buy a stock that is at or near its 52-week low
2. Thou shall usually buy a stock that is selling for $10 or less
3. thou shalt usually buy stocks with weekly volume over 1 million shares
4. Thou shalt only buy stocks found on the New York Stock Exchange, American Stock Exchange and NASDAQ Stock Exchanges
5. Thou shalt look for stocks with large institutional and/or insider ownership
6. Thou shall buy stocks that have favorable futures and good pasts
7. Thou shall usually buy stocks that pay no or a very small dividend
8. Thou shalt only buy riskier stocks after thou hast bought several more stable stock first
9. Thou shalt usually buy stocks that have long term debt less than 1/3 of the latest revenues
10. Thou shalt buy stocks in industries with the future (for example gambling, biotech, computers, not stagecoaches)
11. Every once in a while you got a break the rules!
These are my 11 Commandments and they will help you make the right choices. As you can see, you will have to take the stocks you found from the databases and do a little more research on them. Research is very easy to do. I will give you the best sources – some are free and some cost a modest amount. You will do better if you have done the research. I'll explain how to use the various research tools to help you choose. But first an explanation of the basic rules.
Rule 1 – Thou shalt only buy a stock or ETF or LEAP or closed-end fund that is at or near its 52-week low
Remember the saying, "it's not what you buy, but when you buy it”. This is the most important rule and the ruled that will help you the most. Following this rule will make you the biggest profits.
The easiest way to find the high and low price is to go to a good financial website like Yahoo. Yahoo's website is http://www.yahoo.com then just click on Finance in the left column and type in any symbol for any stock or ETF you want information on. Also Barron's has a very good website if you want to look at all the stocks on the New York and NASDAQ stock exchange. Their website is http://www.barrons.com – just scroll down to the bottom and look for the link to stocks which is way down on the bottom.
Also you will find a good list of potential AIM stocks, ETF's and LEAPs in my monthly newsletter that you will receive for free for being kind enough to buy my book.
Other services have good information if you're willing to pay for it. Check out the beginning sections of Value Line – they have a summary listing stocks with lowest price/earnings (P/E) ratios, lows book value, stocks with the highest estimated future returns etc. They also show a section showing high-growth stocks and worst-performing stocks (biggest % drops). Every issue of Barron's does the same thing in the Winners and Losers section. For additional free info, send off for the latest annual report from the company. When you scroll down the stocks in Barron's, any stock that you see the symbol for clubs next to, you can easily e-mail through Barron's and obtain a free annual report.
Remember at or near its 52-week low – it's the Cardinal Rule for Profits.
Rules two, three, and four are self-explanatory.
Rule 5 – Thou shalt look for stocks with large institutional and/or insider ownership – at least 40%
For this rule and the rest of our rules, we must look to outside research. Just following rules one through four will make us a good profit. But little extra research that doesn't take that much additional time or money and will help us make even bigger profits.
A free source of information is the Standard & Poor's Reports. Remember like I said earlier you can easily find them in the research section of most online stockbrokers. I know that TD Ameritrade does have Standard and Poor Reports, Zack’s Reports and some other research report so you can literally OD on research for free and find out all the information you'd ever want at any particular investment.
Why does owning a stock with a large institutional and/or insider ownership help us? This helps us for several reasons. When a large company holds a big block of stock, that block can actively trade. When institutions buy in big blocks the price will go up, when institutions sell in big blocks the price will go down sharply. This will help us AIM investors to get the volatile swings that help us make money with AIM. For example one stock I own, US Surgical, plunged $15 a share in one day because analysts downgraded the stock because they felt revenues wouldn’t grow as fast as they had in the past. That caused many institutions to dump the stock (it wasn't my 33 shares that caused the drop).
Normally when stocks go up or down, the volume traded goes much higher. A stock may average 1 million shares traded a month, then it goes way up or down in price and you see it traded 2 million shares in one week! These volume numbers show the big players were involved. You can take advantage of this – you buy when they sell and you sell when they buy.
Another and better way to find institutional ownership info and wealth of other valuable information for free is again like it been telling you the eight-page Standard & Poor's Report available for free from most online brokers.
For now were only interested in the institutional ownership info in the Standard and Poor Reports. I'll tell you how to use the reports for other information we want. The place to find Institutional ownership is at the top of page 1. Look for the line "% held by institutions". For example, I'm looking at Jan CF Pharmaceuticals, on the NASDAQ exchange and the % of institutional ownership is 66%, very good.
S&P research reports give you additional related info – insider holdings. If the company has a large block of stock owned by the company officers and directors, it will be listed here. One reason I bought US Surgical (high – $114, low – $28, I bought at $30) was because institutions owns 62%, officers and directors own 31%; leaving only 7% trading with us, the general public.
The place to look for insider holding information is in the eight-page Standard & Poor's Report. You will quickly find out that Standard & Poor's literally uses the same standard in every report so once you get familiar with the reports will find the same type of information you are looking for in exactly the same place in the report. The S&P Reports are really excellent sources of up-to-the-minute info and again I highly recommend them.
Rule 6 - thou shalt buy stocks and closed–end funds and ETF's that have favorable futures and pasts
What does this mean? Again remember investing is an art not a science. For a favorable past, I like to look at the price history, P/E, revenues, profits (earnings). Let's use US Surgical as an example. In the Standard and Poor's research report is a section called "Income Component Analysis". Look at the bottom and you see five years of prices and P/E (Price/Earnings) history. The P/E ratio is the ratio between share price and earnings per share. If the stock sells at $10 and earned $1 a share, the P/E is 10. If the stock earned $.50 a share, the P/E is 20.
When I looked at the price and P/E history of US Surgical, here's what I found:
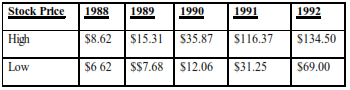
No P/E for 1992 because the year wasn't finished at the time I was typing.
Now the price history looks pretty good doesn't it? Well it gets even better. Another item must be checked – stock splits. You will find stock splits highlighted on the chart showing the price movement of any particular stock you are looking at in the Standard and Poor's research reports and maybe elsewhere in the report. When I wrote this about 20 years ago stock split information was under the category "key statistics at a glance", you could find any stock splits in the last five years .Also shown in the chart on front page
Looking again at US Surgical, we find 2-for-1 stock splits in 1990 and 1991. Thus if you owned 50 shares; after 1990 you now own 100 shares and after 1991 you owned 200 shares. Stock splits usually mean the company has been doing well and investors are eagerly buying the stock, pushing the price up. Most companies want to keep their stock prices lower to encourage more people to buy and thus split the stock. I regard stock splits as favorable.
However reverse stock splits (such as 1 for 10), I regard as a warning that this is a risky stock. I also regard this when it comes to leveraged ETF's as a warning but also a chance for profits because the price on the ETF must've come way down in order to institute a reverse split. For example your US Surgical would've gone from 50 shares to 5 shares if a 1 for 10 split occurred. This usually happens in companies where share prices are pretty much near their 52-week lows. For example, one of my stocks, Saachi and Saachi had a 1 for 10 split and my holdings went from 600 shares to 60 shares and the stock price rose from $.75 to $7.50. Company barely made me a profit, and I got rid of it when it showed a slight profit.
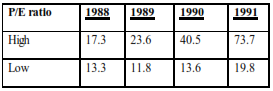
Looking at the P/E high and lows shows you that the stock was profitable all five years. Stocks only have P/E's if the company was profitable. Thus in Barron’s, if you see a stock with a blank P/E, the company lost money in the last measurable period. Looking at the P/E, US Surgical was profitable all five years. Looking at the P/E's showed people were willing to buy with a P/E as high as 73.7.
I bought US Surgical at $30.25 when it showed a P/E of 13. Looking at the five-year history shows me that buying US Surgical was a good deal with a P/E of 13. Normally I like stocks with low P/E's; any stock at 10 or less I want to know more about.
Also in the Standard & Poor's Report, you'll find revenue and income info. Here is what I found for US Surgical: (M = millions):
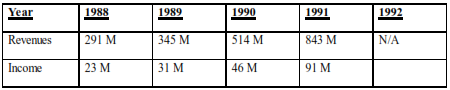
The rise in revenues and income shows a good pattern to me. This is a good semi – aggressive stocks with great high/low swings. This is the type of stock to start with and build on. Notice buying the stock violated the rule about buying stocks costing more than $10 a share. As rule 11 says, sometimes you gotta break the rules.
Now the future. Read the Business Summary and Important Developments in the Standard and Poor’s Report. Towards the back of the S&P Report you'll get an industry Outlook on the industry your company is in. This will show you whether you have a "stagecoach industry" company or one in an industry with a good future. Also you'll find summaries of the latest newspaper articles that talked about your company. You will also find those on the Yahoo Finance website after you put in the symbol for any particular stock. Always a good idea to look at the latest newspaper articles about any company you're considering buying.
Now after reading all this and Value Line will have pretty much of the same info, do you feel good about the stock? Does it give you a warm fuzzy?
I think if you have done this a few times, that you'll have the ability to decide what stocks are good buys. Your hardest problem will be picking from a group of good buys. Remember you only want a good buy, don't agonize trying to pick the stock of the year. And when you do, you must stick with your stock through thick and thin – don’t wimp out and sell at a loss unless there is absolutely no chance the stock will rise again.
Rule 7 – Thou shalt usually buy stocks (doesn't apply to closed-end funds) that pay no dividend or a small dividend
Most stocks that pay large dividends will never appear in your searches because they don't fluctuate 100% a year and usually cost over $10 a year. One group of buy candidates, closed-end funds, usually do have large dividends. And low prices and 100% price fluctuations. Have your cake and eat it too! Over the years I've relaxed my rule of trying to only buy stocks that are $10 or less. I have expanded my range to try and give you the best stocks every month and my newsletter regardless of what their price is in terms of absolutely higher or lower than $10.
If any stocks that you do own pay a dividend or same with the closed-end fund, I recommend you tell your stockbroker to reinvest your dividends into your money market account and not to automatically buy more shares. Let AIM determine the price you buy shares at and it will make tax time a lot easier for you.
Rule 8 – Thou shalt only buy riskier stocks after thou hast bought several more stable stocks
Each of you knows what level of risk you feel comfortable with. A good book on the subject is The Nature of Risk by Justin Mamis. I recommend you read it.
Stocks come with different risk levels. I'll give you an idea of what I consider "safer" stocks. Then I'll give you an idea of what I consider "riskier" type stocks. You can decide for yourself if riskier stocks have a place in your portfolio. Riskier stocks can offer you for greater profits than safe stocks, but are not for the faint hearted.
Safer stocks are companies with:
– At least $100 million in revenues;
– Companies making a profit;
– Companies with share prices higher than $3 share;
– Companies with high/low swings less than 300%.
For example, if the low is $5 a share in the high is $15 this is a safer stock. A riskier stock would be one with a low of $1 and a high of $12. Safer companies would show steadily rising revenues and income such as US Surgical. Riskier companies often have a bad year or two, lose money and thus the stock drops way down. I bought Synergen, a biotech on the NASDAQ after the price went from $67 to $11. Riskier stocks can easily rebound and the thus make you bigger profits. If Synergen discovers a hot new drug, the price could shoot back up quickly.
Riskier stocks include stocks in bankruptcy, stocks trading for less than $3, and stocks with high/low differences greater than 300%. Stocks in bankruptcy usually have the symbol "VJ" in front of their name or on the NASDAQ Exchange, the fifth letter in the stock symbol will be Q. This means the company is in Chapter 11 bankruptcy. The courts give the company 3 – 5 years to straighten themselves out. This usually means that creditors have agreed to smaller or no payments on debts owed them for a period of time. Normally companies in bankruptcy trade for less than $3 share, many times they trade under $1 a share. Looks through Barron’s and you'll see many stocks trading at $.25 or less. You might see a high of $1 and a low of $.12. That's a great percentage spread and offers great profit potential but with a greater risk.
I'd advise you to wait until you own three or four safer stocks before you add a riskier stock. Now since the stock is riskier and since it's low priced, you don't need to invest the usual $1,500 per stock. Cut this in half, put $500 into the stock and $250 into your money market and then follow the regular guidelines for setting up the stock. I have changed my tune on this and feel if you are going to go with riskier stocks definitely you need to keep the CASH/SHARE VALUE at 50-50%. Later on I'll give you a really wild strategy for playing riskier stocks after you've gotten rich from the system. I'd recommend one – two riskier stocks in a 10 stock portfolio for the average investor.
Rule 9 – Thou shalt usually buy stocks with a long–term debt less than 1/3 of current revenues
Stocks with 1/3 or less long–term debt are safer stocks and stocks with high debt levels are riskier stocks. You can find the long–term debt amount under Capitalization in the Standard and Poor Report. An example of a riskier stock is RJR Nabisco holdings – earnings were $15.7 billion but long–term debt is $13.5 billion.
Rule 10 – Thou shalt buy stocks in industries with a future
This goes along with rule 6. Look for industries and products of the future. Right now a product of the future that has several stocks at very low prices is solar energy products. The solar energy companies have really taken a dive lately so they may be worth looking at as good investments if you can take a long term view. Off the top of my head biotech, medical, gambling, Internet, social networks, are a few I like.
Right now the medical/drug industry is very depressed because of uncertainty over what President Clinton will do with healthcare. Déjà vu now the meta-health/drug industry is concerned with Pres. Obama will do about healthcare. A little research will reveal very good bargains. But watch out for companies in a dead-end position in a good industry. Right now IBM fits that bill (1980s) – mainframe computers are dying out. But later IBM was smart enough to reposition itself and has stayed a very successful and profitable company and you will see just how well you would've done buying LEAPs on IBM through the years when you look at my model LEAPs portfolios that you can find on my webpage http://www.jjjinvesting.com
If you keep informed about financial information either on the web or in a financial newspaper, you'll find articles showing you industry trends. Read Barron’s regularly and you'll have no trouble seeing the good industries of the future.
Rule 11 – Every once in a while you gotta break the rules
When a great opportunity comes along, you can ignore one or more rules (except rule one!). I violated my rule of only buying stocks under $10 when I bought US Surgical at $30.25. Why? It was selling at 25% of its high for the year. It offers low – cost alternative surgical procedures, and revenue growth was still excellent. I recommend that you also do the same and scan stocks over $10 for outstanding buys. My monthly list of good buy stocks in my newsletter always includes a few stocks over $10.
Always remember investing is an art not a science. You make the best choices and then play the system and be patient. You're in this for the long term.
Now I promised you a riskier strategy. This will not be for most of you but I want to get you thinking about exploring the possibilities of the system and this is a good way to do that.
Search stocks and look for all stocks selling currently for $.50 share or less. Then do the same thing you do with any stocks you're thinking of buying. Find the current high/low and current price and only consider stocks selling at or near their year’s low. You could also use this strategy to find one or two riskier stocks to put in your 10 stock portfolio.
Here’s the risky strategy. Buy 10 risky stocks selling for $.12 or less now. Just about all of them should be stocks in bankruptcy. And you know how to check for bankruptcy. Put $100 into each stock and do nothing until the stock hits $.50 a share and then sell all of the stock. This is very easy to do with your online broker. All you have to do is leave a limit order to sell all of your shares at the $.50 price that is good until canceled. Good until canceled limit orders usually will run for three months so you don't have to worry about missing that one magic day when your stock hits the $.50 plateau. Your broker’s computer will automatically take care of you and make sure you get that sale.
If only four of your 10 stocks do this, that means go from $.12 to $.50, you'll be ahead 60% even if the other six go completely bankrupt. Look at the math below:
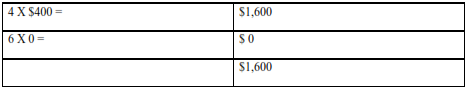
So you started with $1,004 and 4 of your 10 went up to $$.50 so your portfolio went from $1,000 to $1,600 pretty good, and probably quite exciting watching the roller coaster ride on those 10 stocks.
I nicely ignore commissions, phone calls, etc. because they lower your profits.
If a risky strategy doesn't appeal to you, stick with whatever strategy you feel comfortable with. My strategy, my 11 commandments are designed for the small investor who wants to put $1,500 into stock.
If you are large investor and would like to put $100,000 into 10 different stocks – please call me immediately. I'll quit my job and work for you and design a perfect strategy for you. Bigger investors can go with more conservative stocks that don't fluctuate 100%. Reread Chapter 9 of my book and learn the conservative strategy to see how successful you can be with really conservative stocks as a large investor.
I hope this gives you some help in picking stocks. By following these ideas, you'll be able to take good stocks with just a little practice. Treat this as a rewarding hobby that will pay you big profits. Keep it fun and remember the system will always tell you the right thing (buy, sell, or do nothing). Just be patient and remember you're going to make a heck of a lot more money from stocks than from banks.
My monthly newsletter soon begins its 18th year. It gives you a list of stocks, ETF's, LEAPs, that I like, ideas for improving the system, and other useful info I think will help you. Please share my flyer with your friends for information and prices.
I truly hope and believe you'll be successful. I want you to achieve your dreams and goals. Use the system to obtain the future you want and deserve.
Postscript
I received a very nice letter from a four former student who followed my Mark Twain advice and lavished praise on me. But more importantly he took the time to send me a list of rules he devised for selecting stocks that I'd like to share with you. I'd like to publicly thank Steve Donahue of Georgia for sharing these rules and I now hope they will benefit you also. And Steve if you're out there I'd love to hear from you; we have lost touch for far too long.
He prefaced his list of rules with a few comments he gleamed from six months of learning about stock selection (May you all be so dedicated).
Steve had several ideas on determining the health of a company. He said my idea of simply looking at long–term debt as a percent of revenues was a rather weak measurement of debt and quite deceiving at times. He said Barron’s, Forbes, Business Week, etc. all refer to Debt to Equity Ratio. But Steve found each publication used a different formula to determine the ratio. (See Barron's Finance and Investment Handbook for three different types of debt/equity ratios). Steve decided to use the following definition:
Debt to Equity Ratio: Long-Term Debt plus Total Current Liabilities divided by Total Common Equity
Steve says the lower this percentage the better, anything below 40% he feels is good.
Steve found earnings to be of paramount importance. Very often, publications refer to the Earnings to Equity Ratio. This is a good measure of how efficient and productive a company really is. This is also a measurement of growth in earnings and control of costs. The ratio was also found using several different formulas. Steve felt Value Line had the best formula noted as % Retained Net Worth on its statistic page of each company (third to bottom column). The higher this percentage the better (12% is about average for an average company). Value Line uses this formula:
% Retained New Worth (Earnings to Equity Ratio): Net Profit (Net Income after Taxes) divided by Net Worth (common equity)