Section 1 – Trends
The myth of market trend
Trend following has been the best style of trading for the past 30 years. There were times when traders made fortunes just by following the trend or following a simple system based on two moving averages crossover. The “buy and hold” strategy that was so popular by traders about a decade ago is dead today.
Look at the EUR/USD chart from January 2001 until July 2008. The uptrend was pretty strong most of the time. If you pushed the “Buy” button, you would win most of the time even with a poor trading system. The consistent rise of the euro over the dollar was giving you a clear sense of the overall trend.
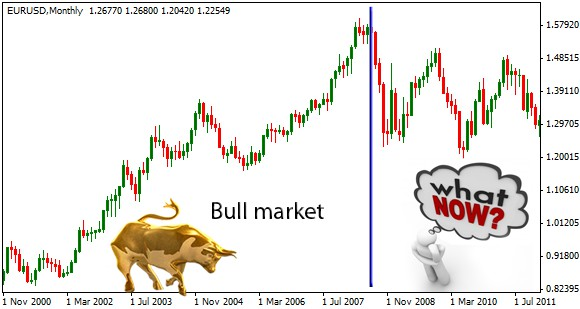
Since July 2008, it looks like everything has changed. The trend direction is unclear, nobody knows what is going to happen next and people are seriously preparing for the coming collapse of the single European currency. By the way, for us (Forex traders) it would be nothing but another opportunity to make a profit, so keep smiling.
Does it all mean that markets are not trending today? Of course they are trending! Trends exist and they can be traded up and down for profit. There will always be short-term trends in any market, the only question is when! So, the big question is…”how do we find the best trending market and not miss the opportunity of taking trading signals in the direction of a strong trend?” You will find a definite answer soon.
The belief that trend following is an outdated trading technique is only partially true. It is true that there is hardly any market with clear overall trend direction. You could follow the temporary trend only if you are able to determine the trend correctly. This is the point where so many traders fail. A pair moving up on a 30-minute time frame can act exactly contrary on an hourly time-frame. Even if you find a rare coincidence – a currency pair moving in the same direction on all time frames – you still need to know “how well” the market is trending to avoid very short-term trends. The solution is smart and simple.
How to increase the profitability of any system
Before you discover the most simple and effective method to determine the trend, let's see what it’s good for. All the trend following systems are based on one common approach:
“Buy the dips in an uptrend and sell the rallies in a downtrend.”
Let's reveal one simple trading system that actually made a fortune for one famous trader and his investors. The system “Donchian 5 & 20” is named after him. Here is the set-up.
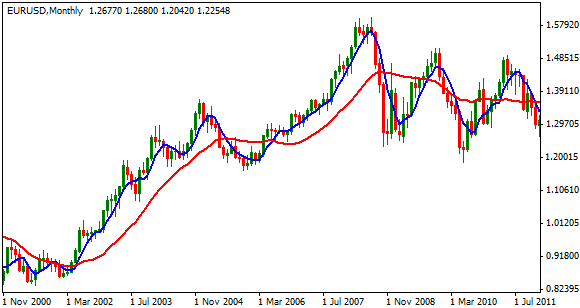
In the chart above, you see two indicators – the blue line and the red line. The blue line is the indicator SMA 5 (stands for simple moving average with period 5) and the red line is SMA 20 (simple moving average with period 20). Donchian's idea was very simple:
1. Buy when the blue line crosses the red line upwards
2. Sell when the blue line crosses the red line downwards
Even a 5-year old child could do this! Actually, there is nothing special about this system. All trend following systems are like this. Some systems are more advanced, with more sophisticated indicators, but the common approach is to buy the dips and sell the rallies.
If everyone could do this, then what's the money making secret?
The answer is that Donchian used this system in strong bull markets. Yes, trending markets! This important note is the key to consistent profits as illustrated in the chart below.
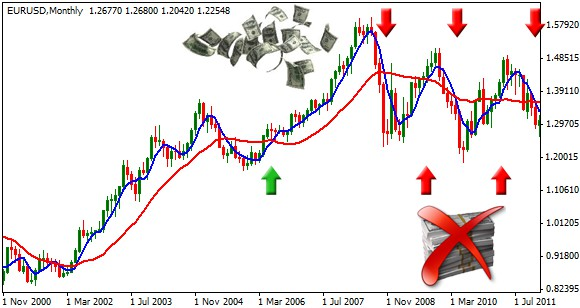
The first trade was profitable because it was made in the direction of the strong trend. The next trades lead to losses as the market was turning up and down without a clear direction. Profits made in the first trade would be taken back in a series of losses.
How Donchian dealt with it was smart. He ignored all trading signals when the red line was not going up on at least a 45 degree angle. He wouldn't take any losing trades after the first trade because the red line is not trending at all. It is in a so called choppy zone. So why was Donchian able to make a fortune from such a simple system while others could not? Because others would throw this system away as not profitable! The only “trick” was to follow a good trend and not taking any other trades.
What is the lesson from this story?
If you know how to determine the market trend correctly, it could make a difference between losing or break-even and winning. Donchian used a simple moving average to determine the trend and filter trading signals.
1. When the market was trending, he turned his system on.
2. When the market was in choppy zone, he turned his system off and ignored any trading signals.
What you can do is just the same with any trading system or robot. Determining the trend using a simple moving average can be replaced with a more sophisticated, versatile technique that you will learn in the next pages.
How to determine the trend
Some people learn from their mistakes, but smart people learn from other people's mistakes. So let's start with examples of a wrong but very common approach to market trend analysis.
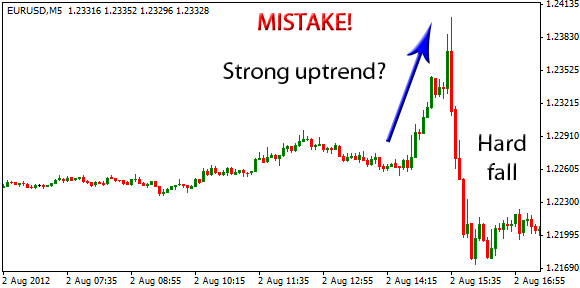
What you see in this chart is explosive price movement that is usually the result of a news release. All brokers, platforms and various currency tools are indicating a “strong uptrend”, tempting people to jump in and make a profit. What happens next is, at best, a choppy zone, or a hard fall.
What is actually in the chart are a few consecutive long green candlesticks. This is not a real trend, but immediate price action, tempting traders to initiate trades and experience a costly and painful exercise. To avoid falling into this trap, you need to focus on longer trends. This is what a real trend looks like:
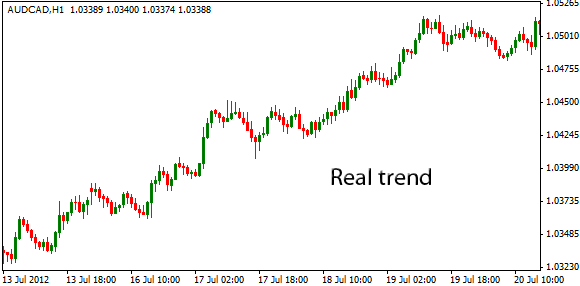
The price is consistently rising with no sudden changes or explosive movements. You can expect that this trend will continue and you should take only bullish signals. Obviously the trend won't last forever and you can even have bad luck by entering the market at the end of the trend, but the odds work for you. It simply cannot be better. There are 100s of free or proprietary indicators to identify the trend but believe or not, no indicator is better than the human eye. As Albert Einstein said:
“Make things as simple as possible, but not simpler.”
Now let's reveal the easy but the most effective method to identify the trend.
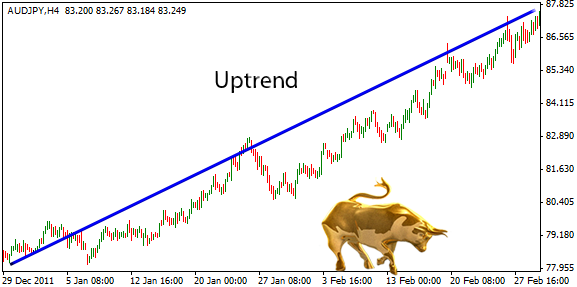
1. Zoom the chart in/out to show about 200 bars. Notice that 200 bars on daily chart (or 200 trading days) correspond to 1 year.
2. Connect the lower left corner with the upper right corner. If the line overlaps with the price bars several times (the more times, the better), you have found a reliable uptrend. See the example below.
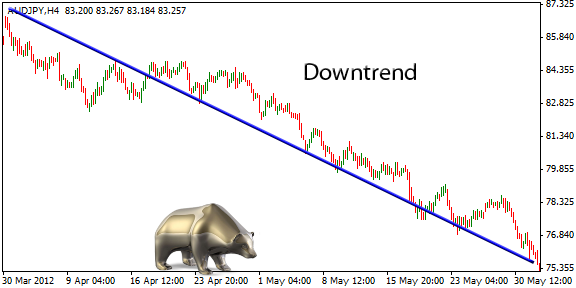
3. Connect the upper left corner with the lower right corner. If the line overlaps with the price bars, you have found a reliable downtrend.
As you see, the market is like a sea wave and it keeps on going up and down. Sometimes the dips are too deep to consider it a reliable uptrend, or the rallies are too high to consider it a reliable downtrend. Knowing the “trend reliability” is the key to discover the real and reliable trend. So, how do we determine if the trend is reliable, or whether it is better to stay off? The best way is to forget any lagging indicators, but to use pure price action.
What is a trend drawdown
Trend drawdown is computed from pure price action and so is the best way to determine the trend reliability. It simply tells you how deep the price went against the current trend. You will appreciate this method in the next paragraph “Protecting against volatility”.
Now, take a look at the chart below.
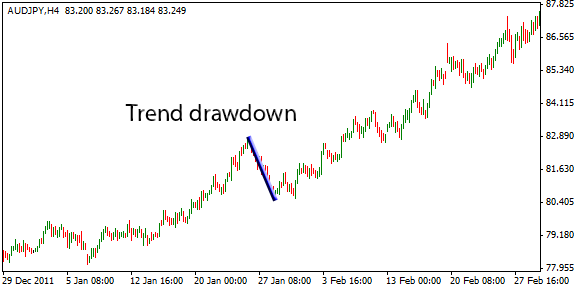
The blue line indicates the deepest move against the current trend. In this example it is 233 pips. The whole move in this chart is 882 pips. The trend drawdown is:
233 / 882 = cca 26%
Not bad. Conservative traders would prefer the trend drawdown to be below 20% as it is more reliable. The ‘big dogs’ prefer trends with drawdown even below 15%. Such trends exist almost every day in at least one Forex chart. Trends with drawdown below 10% are very rare, but when they appear, they are gold mines – you can easily achieve a winning percentage above 90%.
The lower trend drawdown = the more reliable trend = the greater success rate = the more consistent profit!
One more important note:
How many bars should we use to define the trend? We have used 200 bars in the examples above. It is a compromise – not too much, not too little. If you were to use only 20 bars, you would risk entering the short-term explosive market movements which are not real trends as we have explained above. If you were to use 500 bars, you would hardly find any currency chart with trend drawdown below 20%. Before we show you how to systematically pick the best trending pairs and time frames every day, let's look at how to use the trend drawdown in the most important aspect of trading – using a Stop Loss!
Protecting against volatility
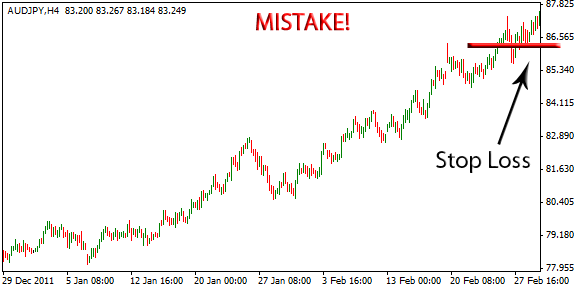
Look at the chart above. The trader who placed the Stop Loss right after entering the market deserves great applause but the problem is, the Stop Loss is too tight! Give the market enough space to breath or the Stop Loss will be hit very quickly.
Some traders use a fixed number of pips, something like 50 pips or 100 pips... this is bad! Stop Loss has to reflect the current market volatility. Ask yourself: “when did the price go as deep as my Stop Loss?” If it has happened several times in the current chart, why would you think your Stop Loss will not be hit now?
The ideal Stop Loss should be greater than the trend drawdown.
Listen to the market, not to the pips. In the example above, the Stop Loss should be at least 233 pips. Too much? Well, use a smaller lot size. If you trade 1 minilot and $233 is above your risk tolerance, then use microlots. Or don't take the trade. The worst thing you can do is use a small pip value just because you want a small risk. Actually, you would risk more because if you don't give the market enough space to breath, the Stop Loss would likely be hit regardless of how good your trading system (or reliable the trend) is.
You would do well if you would use the trend drawdown + 1 pip as the pip value for the Stop loss (233 + 1 = 234 pips in the example). If you want to increase the success rate but on the other side, increase the risk when compared to the profit potential, your Stop Loss should be set at a much safer 1.5 x trend drawdown.
Stop Loss = 1.5 x trend drawdown = 1.5 x 233 pips = cca 350 pips Some traders would prefer even 2 x trend drawdown = 466 pips. Such Stop Loss would be safe enough from the wild market. It's all about statistics.