Types of Charts 1-2-3 Patterns Develop On?
I’ll be very abrupt with this. 1-2-3 patterns appear on all of the charts. Bars,lines, Renko, P+F, candlestick. It makes absolutely no difference. The exact same pattern plays out the same.
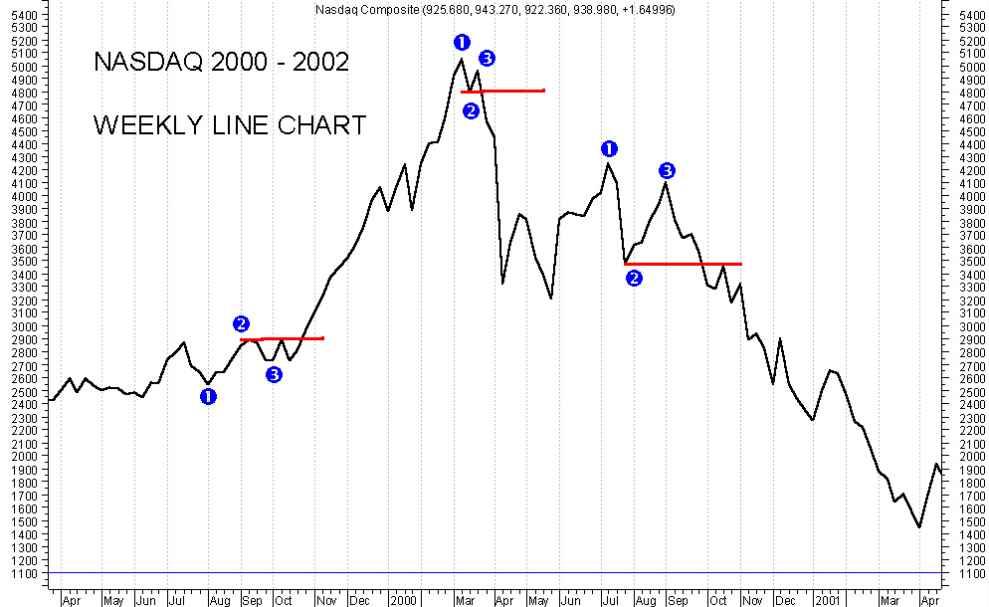
Here is an example of a line chart showing a 1-2-3 pattern:

My only tip when using the 1-2-3 pattern with a line chart is to use
weekly/monthly only. Daily gives too many false signals.
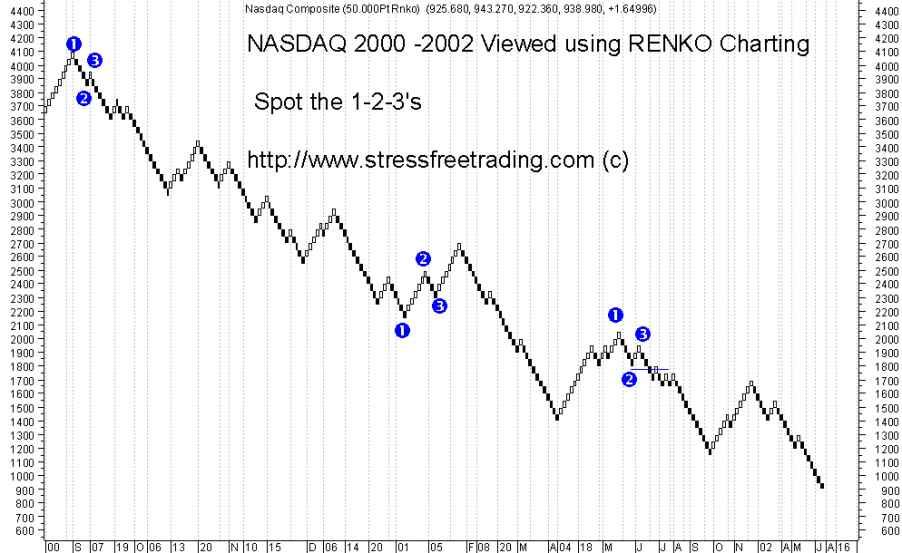
Here is anew one for you. The NASDAQ market viewed on a Renko chart. Spot the successful 1-2-3’s.

Using the 1-2-3 pattern on the indices on a weekly/monthly basis is one of my favorite techniques as to spotting overall market trend changes. When I see a 1-2-3 bottom on a weekly/monthly chart I get very excited. If you spot one I urge you to make the VERY best investment you are likely to make and buy my M.S.T.S
(Momentum Stock Trading System) http://www.stressfreetrading.com this is the way to make BIG money in these market conditions.
Long Short Stocks and Futures.
There is no point in me displaying more charted examples. I have shown you how the 1-2-3 works on:
• ALL time frames
• Both buying and selling
• Stocks
• Futures
• Line/bar/Renko charts
Believe me, if you can chart it, the 1-2-3 pattern will appear.
Now, lets’ look at a slight trick for entry once you have your 1-2-3 pattern.


 My only tip when using the 1-2-3 pattern with a line chart is to use