Fibonacci Analysis and Elliott Waves Theory
6.1. Fibonacci Analysis
The Fibonacci analysis gives ratios which play important role in the forecasting of market movements. This theory is named after Leonardo Fibonacci of Pisa, an Italian mathematician of the late twelfth and early thirteenth centuries He introduced an additive numerical series - Fibonacci sequence.
The Fibonacci sequence consists of the following series of numbers:
1, 1, 2, 3, 5, 8, 13, 21, 34, 55, 89, 144, 233, 377, 610, 987,
1597, 2584, 4181, (etc.) , which exhibit several remarkable relationships, in particular the ratio of any term in the series to the next higher term. This ratio tends asymptotically to 0.618 (the Fibonacci ratio). In addition, the ratio of any term to the next lower term in the sequence tends asymptotically to 1.618, which is the inverse of 0.618. Similarly constant ratios exist between numbers two terms
Golden spirals appear in a variety of natural objects, from seashells to hurricanes to galaxies.
The financial markets exhibit Fibonacci proportions in a number of ways, particularly it constitute a tool for calculating price targets and placing stops. For example, if a correction is expected to retrace 61.8 percent of the preceding impulse wave, an investor might place a stop slightly below that level. This will ensure that if the correction is of a larger degree of trend than expected, the investor will not be exposed to excessive losses. On the other hand, if the correction ends near the target level, this outcome will increase the probability that the investor's preferred price move interpretation is accurate.
6.2. The Elliott Waves
Basics of Wave Analysis
The Elliott waves principle is a system of empirically derived rules for interpreting action in the markets. Elliott pointed out that the market unfolds according to a basic rhythm or pattern of five waves in the direction of the trend at one larger scale and three waves against that trend. In a rising market, this five wave/three-wave pattern forms one complete bull market/bear market cycle of eight waves. The five-wave upward movement as a whole is referred to as an impulse wave, and the three-wave countertrend movement is described as a corrective wave (See Figure 6.1). Within the five-wave bull move, waves 1, 3 and 5 are themselves impulse waves, subdividing into five waves of smaller scale; while waves 2 and 4 are corrective waves, subdividing into three smaller waves each. As shown in Figure 6.1, subwaves of impulse sequences are labeled with numbers, while subwaves of corrections are labeled with letters.
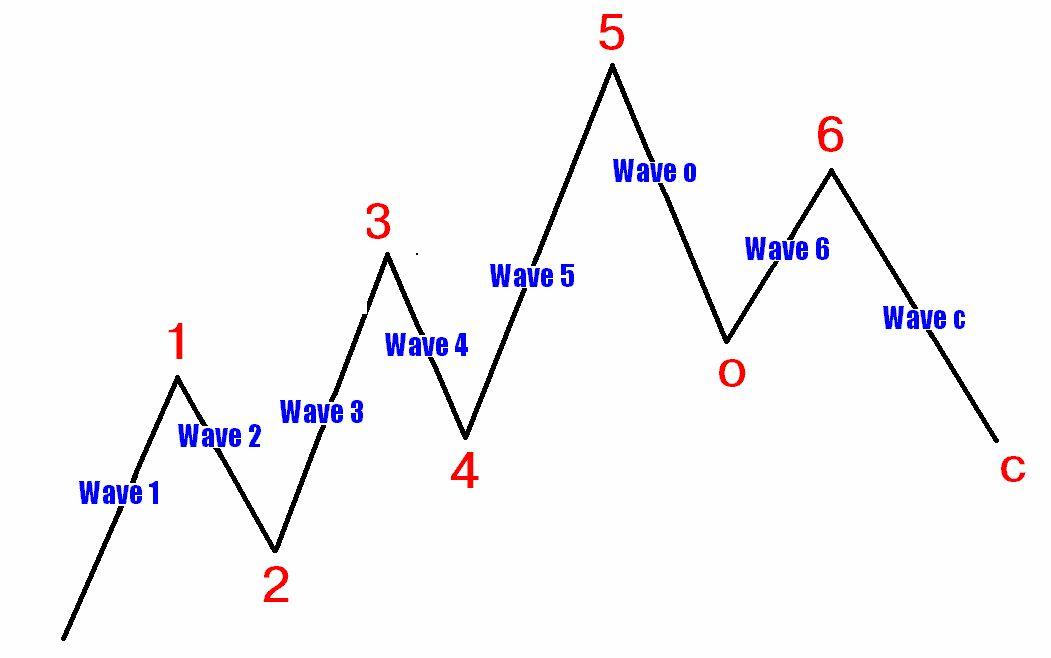 Figure 6.1. The basic Elliott Wave pattern
Following the cycle shown in the illustration, a second five-wave upside movement begins, followed by another three-wave correction, followed by one more five-wave up move. This sequence of movements constitutes a fivewave impulse pattern at one larger degree of trend, and a three-wave corrective movement at the same scale must follow. Figure 6.2 shows this larger-scale pattern in detail.
As the illustration shows, waves of any degree in any series can be subdivided and resubdivided into waves of smaller degree or expanded into waves of larger degree.
 Figure 6.2. The larger pattern in detail
The following rules are applicable to the interpretation of Elliott Waves: 1. A second wave may never retrace more than 100 percent of a first wave; for example, in a bull market, the low of the second wave may not go below the beginning of the first wave.
2. The third wave is never the shortest wave in an impulse sequence; often, it is the longest.
3. A fourth wave can never enter the price range of a first wave, except in one specific type of wave pattern, the form of market movements is essentially the same, irrespective of the size or duration of the movements.
Furthermore, smaller-scale movements link up to create larger-scale movements possessing the same basic form. Conversely, large-scale movements consist of smaller-scale subdivisions with which they share a geometric similarity. Because these movements link up in increments of five waves and three waves, they generate sequences of numbers that the analyst can use (along with the rules of wave formation) to help identify the current state of pattern development, as shown in Figure 6.3.
Figure 6.3. A complete market cycle
As the market swings of any degree tend to move more easily with the trend of one larger degree than against it, corrective waves often are difficult to interpret precisely until they are finished. Thus, the terminations of corrective waves are less predictable than those of impulse waves, and the wave analyst must exercise greater caution when the market is in a meandering, corrective mood than when prices are in a clearly impulsive trend. Moreover, while only three main types of impulse wave exist, there much more basic corrective wave patterns, and they can link up to form extended corrections of great complexity. A most important thing to remember about corrections is that only impulse waves can be “fives”. Thus, an initial five-wave movement against the larger trend is never a complete correction, but only part of it.
Impulse Wave Variations
In any given five-wave sequence, a tendency exists for one of the three impulse subwaves (i.e., wave 1, wave 3, or wave 5) to be an extension—an elongated movement, usually with internal subdivisions. At times, these subdivisions are of nearly the same amplitude and duration as the larger degree waves of the main impulse sequence, giving a total count of nine waves of similar size rather than the normal count of five for the main sequence. In a nine-wave sequence, it is sometimes difficult to identify which wave is extended. However, this is usually irrelevant, because a count of nine and a count of five have the same technical significance. Figure 6.4. shows why this is so; examples of extensions in various wave positions make it clear that the overall significance is the same in each case. Extensions can also occur within extensions. Although extended fifth waves are not uncommon, extensions of extensions occur most often within third waves, as shown in Figure 6.5.
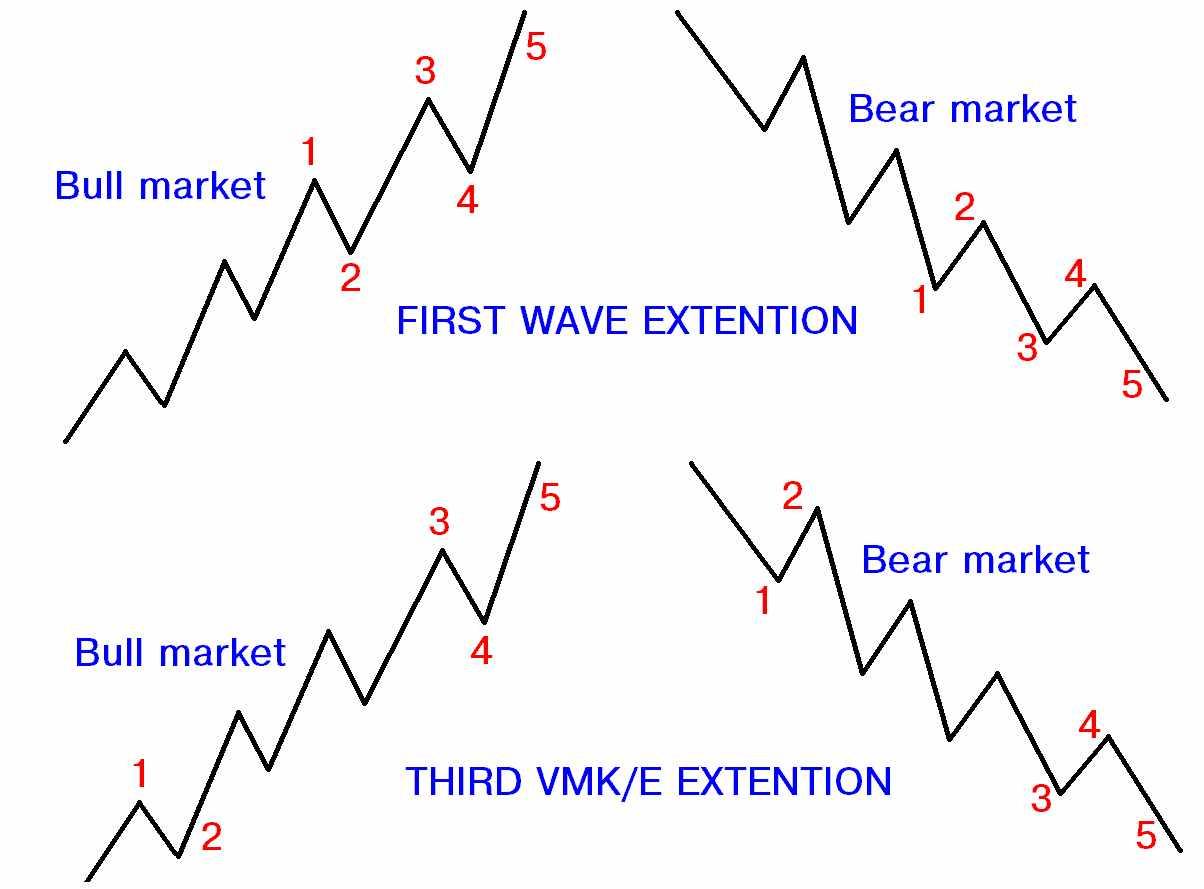
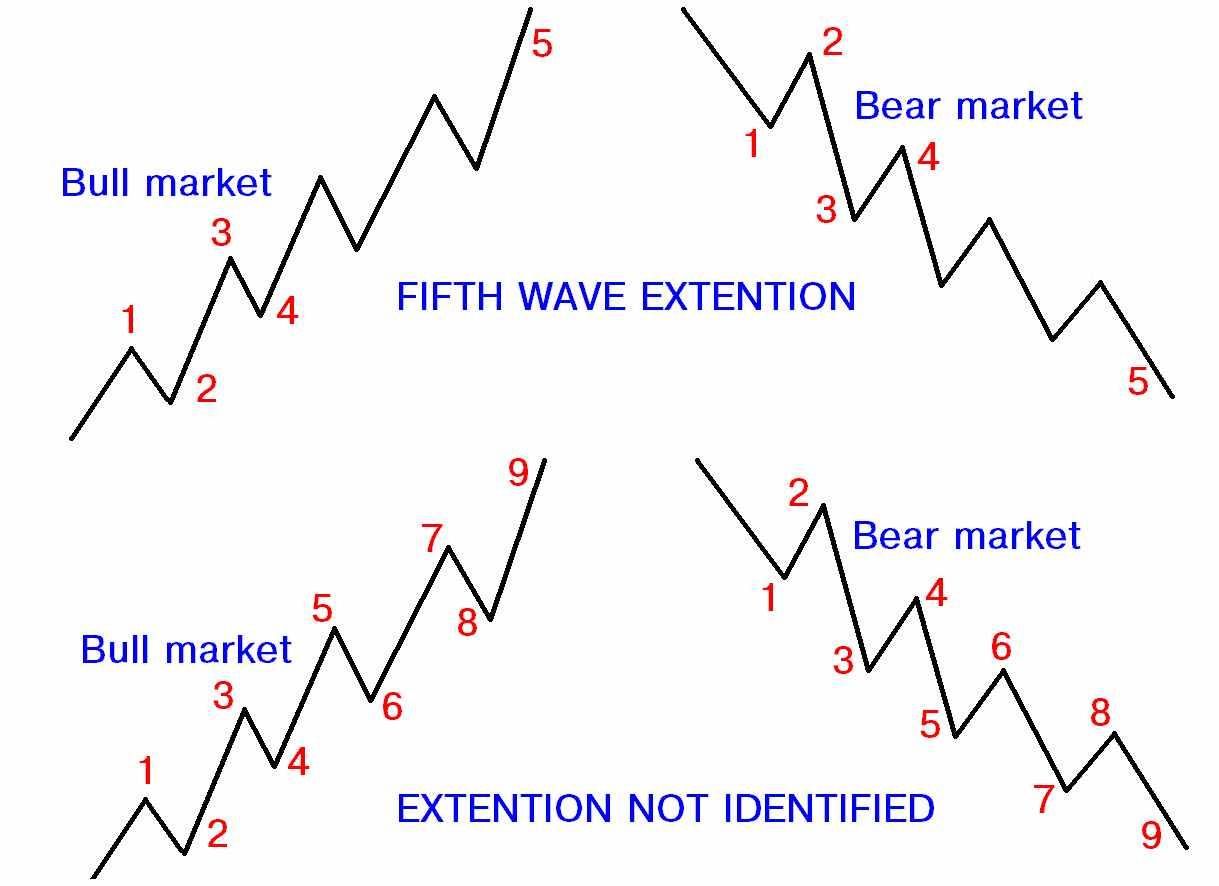 Figure 6.4. Wave extensions
Figure 6.5. Wave extensions
Extensions can provide a useful guide to the lengths of future waves. Most impulse sequences contain extensions in only one of their three impulsive subwaves. Thus, if the first and third waves are of about the same magnitude, the fifth wave probably will be extended, especially if volume during the fifth wave is greater than during the third.
The Diagonal Triangles
There are some patterns familiar from the Technical Analysis theory, particularly two types of triangles, which should be noticed in frame of Elliotts waves consideration.
The diagonal triangle type 1 occurs only in fifth waves and in ! waves, and it signals that the preceding move has, in accordance to Elliott, "gone too far, too fast." All of the patterns' sub-waves, including waves 1, 3, and 5, consist of three-wave movements, and their fourth waves often enter the price range of their first waves, as shown in Figures 6.6. and 6.7. A rising diagonal triangle type 1 is bearish, because it is usually followed by a sharp decline, at least to the level where the formation began. In contrast, a falling diagonal type 1 is bullish, because an upward thrust usually follows.
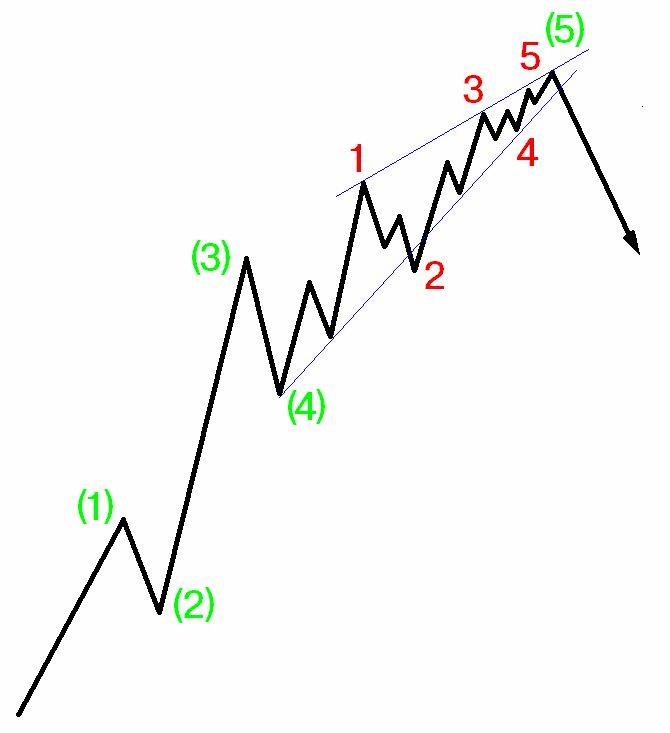 Figure 6.6. A bullish pattern
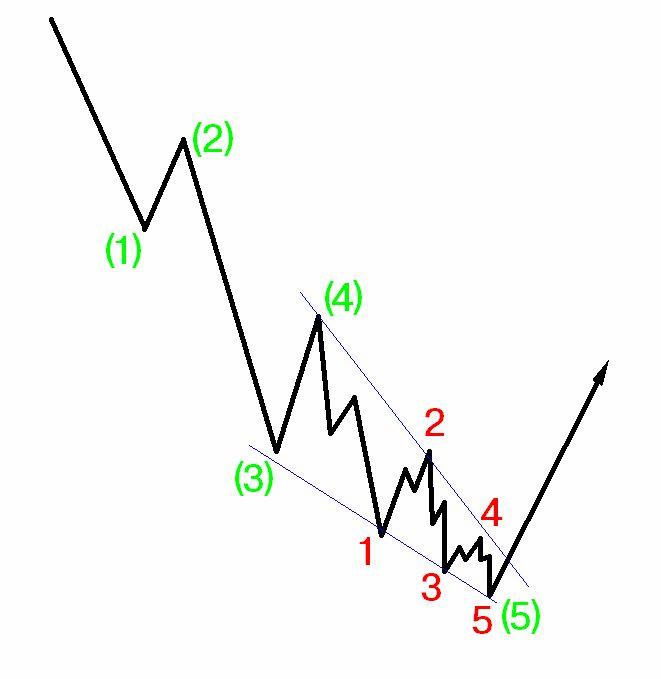 Figure 6.7. A bearish pattern
The diagonal triangle type 2 occurs even more rarely than type 1. This pattern, found in first-wave or A-wave positions in very rare cases, resembles a diagonal type 1 in that it is defined by converging trendlines and its first wave and fourth wave overlap, as shown in Figure 6.8. However, it differs significantly from type 1 in that its impulsive subwaves (waves 1, 3, and 5) are normal, five-wave impulse waves, in contrast to the three-wave subwaves of type 1. This is consistent with the message of the type 2 diagonal triangle, which signals continuation of the underlying trend, in contrast to the type 1 's message of termination of the larger trend.
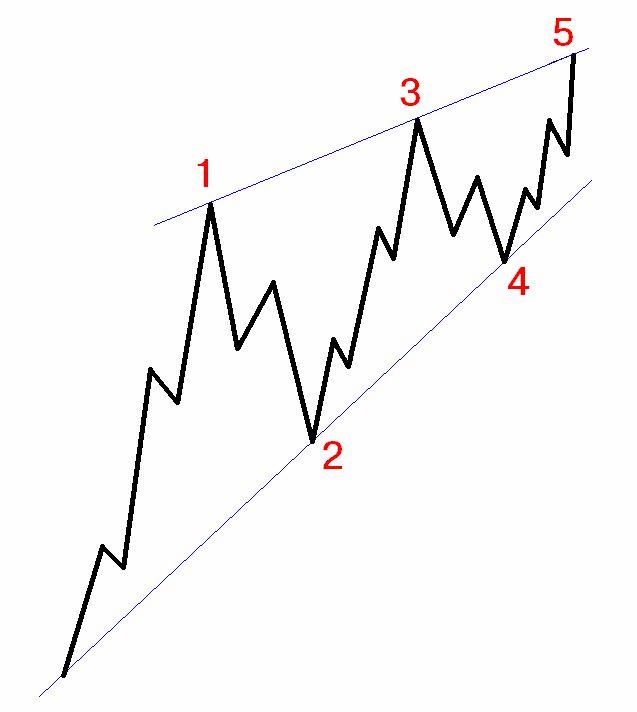 Figure 6.8.
Failures (Truncated Fifths)
Elliott described as a failure an impulse pattern in which the extreme of the fifth wave fails to exceed the extreme of the third wave. Figures 6.9 and 6.10 show examples of failures in bull and bear markets. As the illustrations show, the truncated fifth wave contains the necessary impulsive (i.e., fivewave) substructure to complete the larger movement. However, its failure to surpass the previous impulse wave's extreme signals weakness in the underlying trend, and a sharp reversal usually follows.
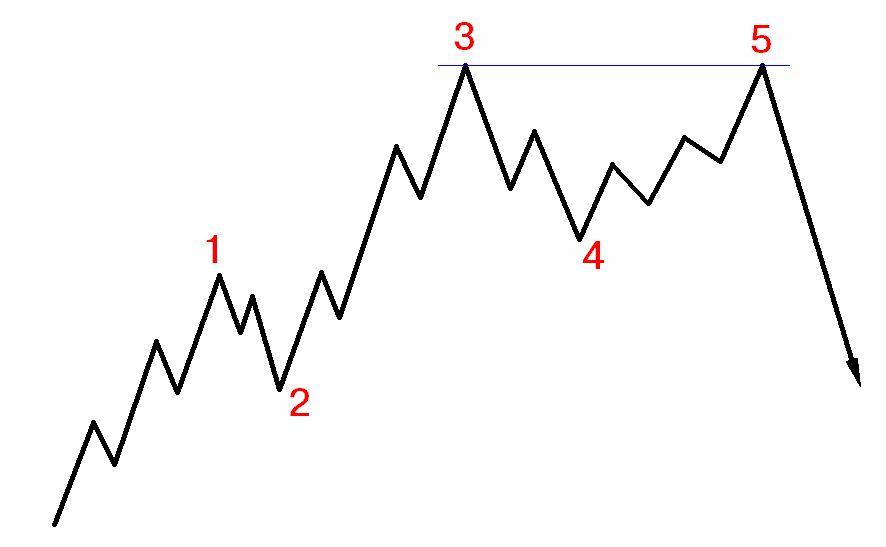 Figure 6.9. Bull market failure
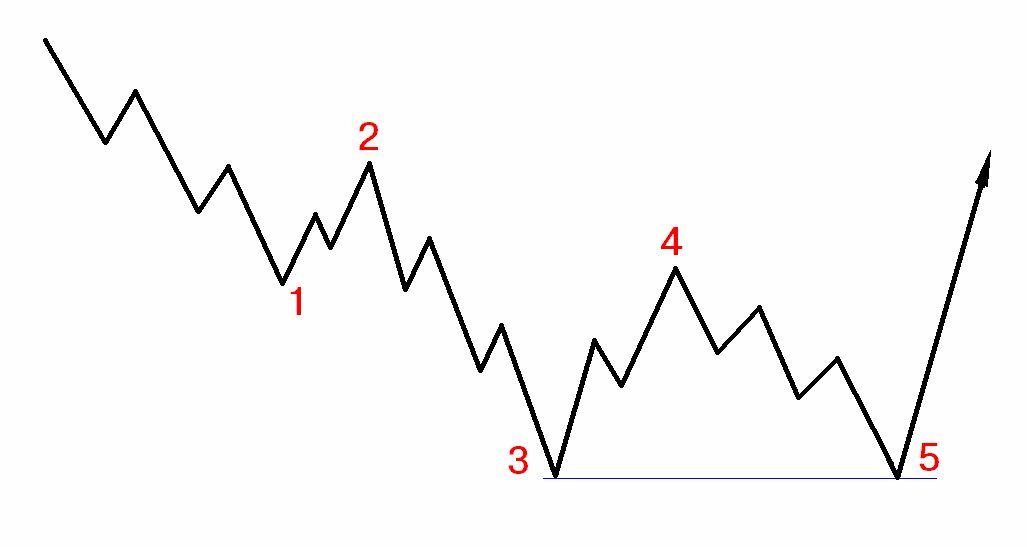 Figure 6.10. Bear market failure


