The theoretical part
What is algo-trading anyway?
Algo-trading, also known as system-trading (or auto-trading / quantitative trading) is a trading method which assumes that al information needed to “beat” today's market can be found in previous/historical data. Algo-traders use sophisticated data mining tools (like
StrategyQuant X) and a huge amount of statistical analysis to design, test and verify their automated trading systems. The resulting systems are ful y automated and rely on fixed (mechanical) trading logic for entry and exit signals.
Algo-trading explained and why it works?
Algo-trading can be done in an unlimited number of ways, however since our lifetime is very limited we prefer to concentrate on one single proven method and become good at it.
The selected method is: Break-out trading.
In automated trading, algorithmic systems are not designed in order to try to
“predict” the next market move, instead the systems are mainly meant to be able to
“catch” the direction of the current price move and “react” to it. That’s the main reason why it works in practice.
IN SYSTEM TRADING WE ARE NOT TRYING TO PREDICTING THE FUTURE. IT’S NOT
POSSIBLE! NOBODY HAS A CRYSTAL BALL, AT LEAST NOT A WORKING ONE:) Most break-out strategies try to react to the market moves, by automatical y opening, closing and managing trades. In most cases we are dealing here with “pending” trades that use: BUY_STOP and SELL_STOP market orders. Figure below shows an example of a bul ish breakout trade setup.
www.coensio.com ©2023
4
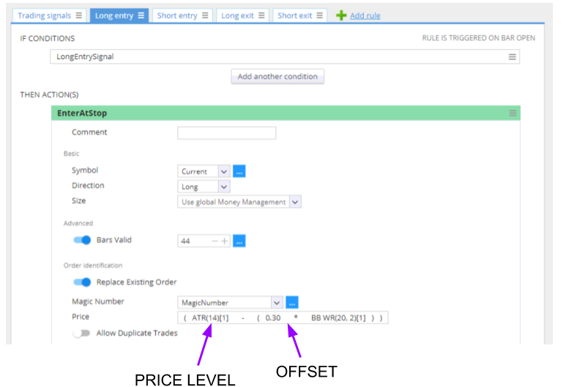

The figure above shows a typical break-out strategy setup, but also a typical strategy logic.
Brea-out strategies mostly are built based on two level: 1. PRICE RANGE or LEVEL = representing current price dynamics and defining a ‘range’
in which price is expected to move
2. OFFSET = a level above/below a ‘range’ at which price action wil be considered as a valid breakout.
Let’s look into SQX AlgoWizard to see this structure, using a typical breakout strategy: Most of the strategies that are generated by the SQX, have this or a very similar entry logic.
Automated break-out trading method is not only proven by us and our smal scale tests, but it is also used by countless number of successful retail and professional traders, including hedge fund managers, managing multiple mil ions of dol ars! Break-out trading =
a serious business when done right!
What is StrategyQuant?
StrategyQuant is a software program that al ows users to create, test, and optimize trading strategies using historical market data. It uses a process cal ed strategy generation to automatical y generate a large number of potential trading strategies, which can then be tested and refined using various parameters and metrics. The ultimate goal of using StrategyQuant is to identify a profitable trading strategy that can be used in live trading. If you are new to StrategyQuant please see the short introduction video first: Go to YouTube.
The pieces of successful break-out trading puzzle
www.coensio.com ©2023
5


If we could describe successful break-out trading it would have the fol owing components: 1. Volatility
2. Proper market timing
3. Liquidity
4. Reliable platform and market interface
5. Proper account sizing
6. Statistical significance
7. Robustness of trading systems
8. Diversification
9. Low correlation
10.Positive expectation
11.High trading frequency
12.Portfolio building method
13.Monitoring and incubating methods
14.Patience
Note: in order to be really successful in break-out trading we need to master ALL of
the above listed topics. If one of all components is missing, the whole system
collapses. It’s like a big puzzle, that not everyone can easily solve, and that’s the
most common reason why most traders will fail and will never become successful
in system-trading. System trading is an extremely complex skill to learn!
In the fol owing chapters we wil describe al of the topics in more detail.
1) Volatility
Volatility means “market mobility” and is a measurement of “market movements”. If the price stays “flat” and there are no price movements, then volatility is low. If the price goes up and down and up again etc. .then volatility is high. Since the break-out trading method is based on “catching” the market moves, we need to have some significant price movements and so we need to have high volatility!
Thus one of the most important lessons in this document is: in order to be successful in break-out trading: we need to target only the volatile markets! Trading using break-outs on markets that do not move much is like trying to catch a fish in a smal puddle = not gonna happen!
So. . glad we’ve cleared that up. Each time I see people struggling and losing money in trading by trying break-out systems on flat markets I get depressed ;) For that and many other reasons let’s forget about the Forex markets for now and let’s concentrate on something that real y works in practice, for example: Indices (using Futures contracts)! Yes,
www.coensio.com ©2023
6


indices, like stock market indices e.g.: S&P500 or NASDAQ. The biggest advantage of trading on those markets is that indices have strong break-out moves, strong long lasting price trends and the futures contract have a very good liquidity (= low slippages). Those characteristics wil help us a lot in our daily trading.
2) Proper market timing: LONG vs SHORT
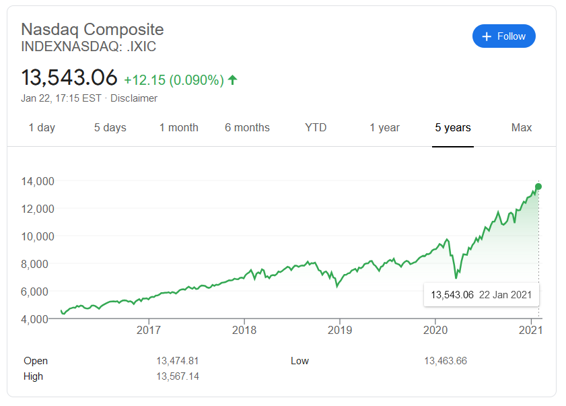
This section is easy to explain. Let’s look at the fol owing figure representing long term NASDAQ index price chart:
Looking at this long term trend, can you tel in which direction you want to trade? LONG or SHORT or both? The proper answer is LONG (most of the time), just because this market has a strong bul ish bias with some bearish mid-term trends or “market crash” periods.
Trading LONG only does not mean you wil always win in this market, but instead it can increase your chances of winning (significantly). To exploit this long term market bias we wil try to find systems with the fol owing characteristics:
● Systems that perform extremely wel during bul ish periods (= high Ret/DD figures)
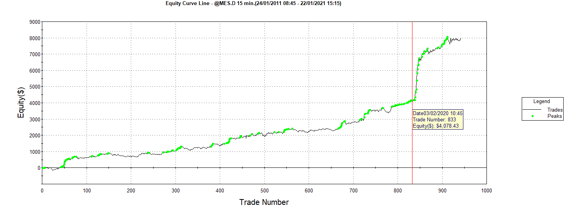
● Systems that do not lose or do not take trades at al during market correction or even market meltdowns, which happen very frequently (refer to: 2008, 2014, end of 2018 and recently in 2020 the coronavirus crash). The equity curve of a good/robust LONG-only system should at least stay FLAT during those problematic periods! =
Very important!
Note: So far most of our LONG-only break-out systems have shown an extremely good response to market crashes during 2018 and 2020.
www.coensio.com ©2023
7


Does it all mean we will take LONG only trades on all markets? No of course not, but it’s the easiest way to start with!
3) Liquidity
Trading in volatile markets is not enough if there is no “liquidity” which describes the degree to which an asset or security can be quickly bought or sold on the market at a price reflecting its intrinsic value. Example: if you want to BUY some instrument, but there is no one that is wil ing to sel it to you at the current price, then this market has a ‘low liquidity’.
Note that in al cases we need to make sure, we are trading only on highly liquid markets AND also, using a platform and a broker providing us a good access to this liquidity. Low liquidity or bad market access wil have a very large, negative influence on our trading results, due to e.g.: order execution delays or higher slippages/spreads.
The bottom line: trading on highly liquid markets with many potential “buyers” and “sel ers”
is not enough, our trading results wil strongly depend on the selected broker! That is why we prefer to trade high liquid futures contracts on a semi-professional broker like Tradestation. See next chapter.
4) Reliable platform and market interface
As discussed in previous sections, our trading results wil strongly depend on the selected market interface. This includes our trading platform and the selected broker.
www.coensio.com ©2023
8


Trading platforms: From our experience (real trading) the best and most robust trading platform is TradeStation (also MultiCharts can be used). In this guide we wil only concentrate on the TradeStation platform.
Why not MT4/MT5 which are so common for beginning traders? Simply because, after so
many tries, we couldn’t not find any honest MT4/MT5 broker that would let us win. Period.
Brokers: We like “Tradestation” broker for many different reasons, which wil be explained later in the upcoming sections :)
VPS: Unlike on MT4/MT5 brokers, on Tradestation broker VPS trading is not mandatory! It’s a “nice-to-have” but it’s not necessary to become successful. Do not spend too much time on this topic, if you are living in a wel developed country, your standard internet connection with a standard power grid stability should be enough to start with. VPS is only a costly improvement which can come later when you wil get familiar with algo trading.
5) Proper account sizing
Account sizing, or trade sizing is very important, especial y when trading futures (ful /mini or micro contracts). It wil determine your risk level, but also wil have a large impact on diversification of your trading in general (= it wil put a limit on the maximum number of strategies you can run on your account). For proper account sizing you need to take the fol owing points into account (note that some of those topics wil be discussed later in this guide):
● The maximum number of simultaneously opened trades (= number of trading systems)
● Maximum total expected drawdown (historical, or historical monte-carlo simulated drawdown)
● Maximum total expected equity drawdown of open trades (MEA = Maximum Adverse Excursion)
● Required margin per each traded instrument (= your broker’s leverage) and maximum order size (contract size) per strategy.
Lucky for us al of the required information wil be provided by the broker and our tools during the system design phase. So after doing our homework, we wil get a clear overview of our account sizing. The figure below represents an overview of how money on our account wil be divided.
www.coensio.com ©2023
9
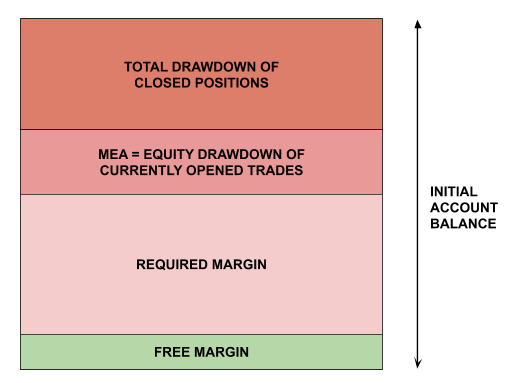

The goal is to make sure our free margin level wil never drop below the critical ‘margin cal ’
levels defined by our broker. Basical y our account size should be always higher than the total sum of al of the red parts as presented by the figure. If your open account balance (=equity) drops below the level of the currently ‘required margin’, then you wil get a
‘margin cal ’ notice from your broker. Basical y they wil start to automatical y close your positions even if they are in a huge drawdown.
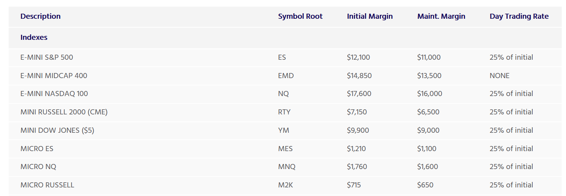
Figure below shows margin requirements for futures contracts on Tradestation broker: Source: https://www.tradestation.com/pricing/futures-margin-requirements/
This is somewhat problematic, since it means that for example we need to have at least $1760 of free available equity in our account, only to be able to open 1 contract position on micro NASDAQ futures market (MNQ). And this is not even including a possible intra-trade drawdown which can happen during every trade. So in practice we wil need at least $2500
or even more just to be able to trade 1 of our systems!
www.coensio.com ©2023
10


A good practice in the beginning is just to open 4 separate mini accounts (~$3000) each and trade only one system per account! And we need to always closely monitor our draw-down and margin levels in order to not get into troubles!
6) Statistical significance
‘Statistical significance’ is another huge reason why most traders fail in their auto-trading.
Why? Because nobody talks about it. .and I real y do not know why most people ignore this very important concept. So we wil give this topic the attention it deserves;) Basical y, statistical significance tel s you one extremely important thing: if you can 'trust' your results which you see in your backtests or forward tests or is everything that you see just an il usion caused by noise or a random luck.
To make clear what statistical significance is, let's look at the scientific concept known as P-Value. I wil try to explain that using two examples: Example 1: The P-VALUE is calculated by big pharmaceutical corporations each time they are testing new drugs in order to check if a new drug is real y effective or if the positive results are purely accidental (due to randomness or luck). So, for example they are running tests on 20 different test groups (each group has several hundreds of people) where only 1
group of 20 groups wil get the real drug and the rest of groups wil get fake drugs (candies). After some months they wil compare if the results in this one group with the real drugs are real y much better than al other 19 groups with fake drugs. If the results are significantly better, then it means that the calculated P-VALUE is 5% = 1 group out of 20
groups (1/20= 0.05 = 5%). This 5% is the minimal scientifical y accepted level of P-VALUE, where you can assume that your results are statistical y significant. Moreover, P-VALUE of 1% (1 out of 100) is much stronger than 5%. This also applies to trading and optimization, for each single optimization result you need to check what the resulting P-VALUE is and determine if this is a real y profitable setting or just a random lucky shot.
Example 2: Imagine you claim to have a system or crystal bal (or a system) which is capable of predicting results from a simple coin toss sequence. Of course, I do not believe you and of course I want to test if you are tel ing the truth. So in order to test your claims I need to perform the fol owing experiment: each time the coin wil be thrown (heads or tail) I wil write down your prediction upfront, but I wil also write down al results from 19 other random prediction (for this I wil use 19 different coins, which I wil throw in paral el with the main coin to generate 19 random predictions). So, if your claim (or system) is right I need to see a significant difference in prediction accuracy between your predictions and my 19 randomly generated predictions, after some X-number of tosses. This is because my
www.coensio.com ©2023
11
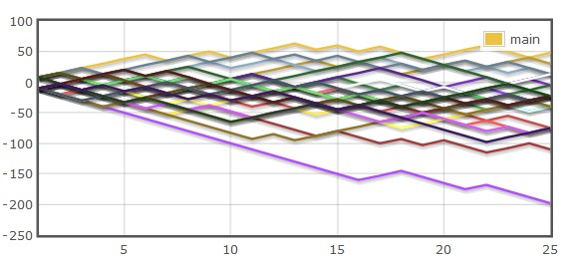

pure random predictions should always result in 50%/50% and your system (if valid) should give a much better win/loss ratio like e.g.: 60%/40%.
This simple test also gives you the X number. This number is the minimum required number of coin tosses (or trades), needed to be able to tel if a given system has any statistical winning edge (= statistical significance). So, for example if you see a profitable system after only 25 trades during the optimization, you need to compare this to at least 19
other random trading systems (like “random coin tosses” in example above). If one or more random results produces equal or better results than your optimized system, then it is NOT
a statistical y significant result. That is why it is almost impossible to optimize using short historical data or higher timeframes (like: daily/weekly basis), since each system wil produce only a few trades. With only a few trades, when comparing the results to “random systems” those random systems wil always produce similar or even better results! You wil not know if your system is profitable or if the positive result during optimization is caused by a random/lucky shot.
You can test it by yourself, but the minimum valid number of trades >= 50. Only after 50 or more trades there wil be some difference between al random systems and any other real y profitable setting. 50 is the absolute minimum 150 or more is considered as stable (note: this number depends on 'degrees-of-freedom' used to generate a system. .keep reading. .). See the fol owing example.
As you can see in the example above after 25 trades the result of our main strategy (gold line) is not much better than randomly distributed results (based on random entry strategy,
= a random coin toss). In that case you can not say if this result is based on a good/robust strategy or just pure luck like shown by the results of random trading systems. This also means that the result is within 'first sigma' of probability distribution of al possible results, within a pure randomness, see next figure:
www.coensio.com ©2023
12
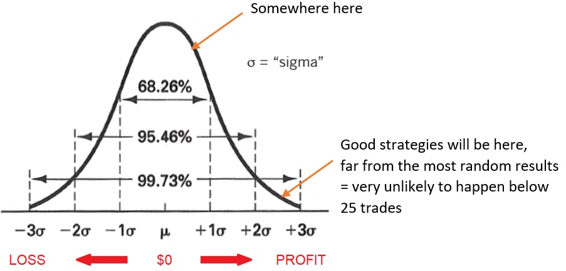
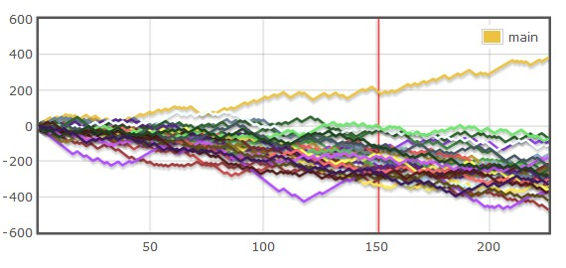

So, after only 25 trades it is very difficult to distinguish good strategies from random strategies. (Actual y, there is one way, but I wil explain it later). Thus, one way to check if the system can beat random systems is to increase the number of trades until there wil be a huge difference between random strategies and the selected EA setting. See the fol owing figure:
In this example the selected strategy (or setting) is profitable over the long term and results in a strong P-Value of 5% (since the final result beats 19 random strategies, 1 out of 20).
Thus, in order to be able to say if the given setting is profitable or not we need to test it over a long(er) period of time using a high amount of trades! The optimization/backtesting results based on a (too) smal amount of trades (<100) have very low STATISTICAL
SIGNIFICANCE and cannot be trusted!
We like to see 600 trades or more in our 10 years backtest results! During development we
will generate strategies with at least 40 trades a year!
www.coensio.com ©2023
13


7) Robustness of trading systems
In fact, using tools like StrategyQuant it is extremely easy to find many strategies with those beautiful equity curves that go only in the “up” direction on any selected market. But this is cal ed ‘curve-fitting’ and this wil get you nowhere near a profitable system. Lucky for us, we know how to test if a given system is ‘curve-fitted’ or not. We use: robustness testing.
The idea of robustness testing is simple:
For each single good looking strategy with a beautiful equity curve we will try to disprove
it! We will do anything we can to prove that this strategy is garbage, we hit it with our
‘sticks’, we will throw ‘rocks’ on it, we will put it on fire and IF and ONLY IF it will still
survive all our efforts to kill it, then we can (only) ASSUME this strategy is not curve-fitted.
Of course we do not have sticks and rocks;) Instead, we wil use our robustness testing procedures. Below just a few examples of standard robustness testing methods:
● Does strategy work on another timeframe?
● Does it work on a different market? Another symbol? Another pair?
● Does it work with increased slippage? How about high real-spread?
● And what wil the equity curve look like, if we wil shuffle the trade order?
● The same, if we wil randomize our initial strategy settings?
● Can we re-optimize the initial strategy settings?
● How about using a different time window for our backtest?
General y the robustness topic is so important, we wil spend most of our time just on running several different robustness and stability tests. And we wil select only a handful of strategies chosen from mil ions of candidates for our live trading. This wil take most of our time so we need to find a way to limit the amount of tests! So, we did. .! Below the most critical the most important test we do to determine the robustness level of our systems: 1. WFM and WFA test: the main core of our robustness testing is walk-forward based.
Why? Because we look at what other professional traders do! They rely on this one specific characteristic of a system cal ed: Walk-Forward efficiency! (Just read the books of the legendary trader Robert E. Pardo.) Moreover there are countless publications/books and proven results that basical y say the same thing: if re-optimized parameters during a walk-forward optimization run show a good healthy improvement w.r.t. the original strategy settings, then we have an increased chance of continuation of this profitable behaviour on the future out-of-sample data.
2. Monte-carlo parameter test: after mil ions of tests we have concluded that if this test passes then there is an increased chance that al other monte-carlo tests wil also pass.
www.coensio.com ©2023
14


3. Additional OOS testing: hereby we wil ALWAYS reserve some part of our most recent historical data in order to see how our system behaves after it comes directly out of our workflow!
4. Other markets test: a very important test that shows us if a given system has been curve-fitted to selected market/historical data or if it has a true winning edge that also works on a different un-seen out-of-sample data from a different, but correlated market. In this test we can see if our system has not been curve-fitted to some random market noise in our in-sample historical data which happens very frequently while building systems using SQX builder module.
That’s it, these are the minimum required tests to ensure our systems have not been total y curve-fitted. In the end this wil not give us 100% guarantee, but it wil increase our chances of finding robust systems!
8) Diversification
Diversification in trading simply means: “NOT putting al of our eggs into one basket”. We wil spread our risk and increase our chances of winning by trading on several different (preferably uncorrelated) markets. Assuming that when one strategy is losing because of some unexpected unfavorable market conditions, then al other systems wil cover for this loss: “one for al , al for one” idea. Diversification does the fol owing to your trading results:
● It lowers the risk of being wiped out due to some black swan event.
● It lowers the total drawdown on the portfolio level.
● It increases the total return/drawdown ratio (RetDD figure).
● It increases the number of trades of your portfolio.
To achieve this we need systems with low correlation. A “correlation” is a measure of how one system is correlated (look-alike) vs another system or w.r.t. a group of trading strategies on the portfolio level. In order to stay wel diversified (as discussed in the previous section) we need to keep system to system correlation as low as possible.
Correlation can be automatical y calculated using internal features of SQX or QA tools (it wil be discussed in the practical part of this guide). Our target is to minimize our portfolio correlation number, which is calculated based on the monthly profit/loss figures.
Natural y we like al of those positive aspects of diversification, however you must remember that this topic is also linked to the ‘account sizing’ issue as discussed in previous sections.
Diversification is a great way to reduce the total risk, but only if it fits well into our account sizing strategy! So it is great if you can afford it by trading many different systems on a larger account! How many? It’s hard to say... 6 is better than 3, but when trading more than 15 systems on 1 account, then you are probably
www.coensio.com ©2023
15


over-trading! There is no hard rule, sometimes only 1 very good, robust and very profitable system is enough to make you happy :)
9) Data correlation: WYSIWYG
Data correlation = a forgotten, but an extremely important topic. Data correlation is the measure of how wel your back tested results correlate to your live trading results on your live account. We’ve spent years on this topic only to conclude that there are not many brokers where we could achieve acceptable correlation between our backtested results and live trades on a live account. That’s one of the main reasons why we have abandoned MT4/MT5 FX oriented brokers:
● FX oriented brokers do not provide they historical data
● FX oriented brokers have very poor liquidity and trade execution (slippages, spreads delays, etc. .)
Assume you have produced beautiful ultra robust strategies in your SQX, and then after few months of live trading on your live account you wil probably see this one thing: The results from your live account do not look as pretty as the backtested results in your SQX over the same period of time!
The main reason = lack of correlation between your historical data and tick data on your live account! Basical y your strategies are developed on other/different data than tick data streamed to your trading platform by your broker!
The second reason = your strategies are developed using different order execution conditions (slippage, spread, delays) than what you get on your broker!
This al wil make you very unhappy after a few months of trading when you wil realize that your SQX results are stil OK on most recent OOS data and your live results are far from being perfect or profitable. So, a good data correlation is THE MOST FORGOTTEN KEY to successful system trading, and it is very hard to accomplish on a Forex oriented broker (MT4/MT5). That is the number 1 reason why after so many years of trying we have switched to a semi-professional broker like Tradestation.
About Tradestation platform and broker:
● It’s a semi-professional broker al owing smal and professional traders as its customers
● They provide their accurate M1 historical data, you can easily import to your SQX in order to design your systems on real historical data
● They have huge liquidity and fast market access, this means very good order execution conditions, low delays, low slippages
www.coensio.com ©2023
16


● And final y: while trading on Tradestation, with systems developed on downloaded historical data directly from Tradestation charts, we have reached almost 1-to-1
correlation between:
○ SQX backtest to Tradestation backtest
○ Tradestation backtest to Tradestation live results WYSIWYG: ‘What You See Is What You Get’ = basically what we see in our SQX
backtest, we also see on our live account in Tradestation. This gives us a very high level of CONFIDENCE in our systems and it speeds up incubation time. If we could speak about the most important thing in our system-trading journey, that would be it.
10)
Positive expectation
There is no point in trading without having a positive expectation w.r.t. trading results.
Basical y we need to make sure that al of our systems have a positive expectation and look profitable (at least on paper). Therefore we do the fol owing:
● We analyze the historical statistics of our systems. First of al we make sure we have a sufficient number of historical trades (as discussed in the statistical significance section). Then, we look at Average Trade Profit vs Average Trade Loss figures and we take only systems that have a significant difference between Avg.Profit and Avg.
Loss. How big this difference needs to be? It depends on our average costs of trading (which is specific to every broker and trading configuration). Example: if our total trading costs (spread+slippage+commissions+swap etc. .) is equal to $2 on average, then Avg.Profit needs to be significantly higher than $2 + our Avg.Loss. E.g.: Avg.Profit=$100 and Avg.Loss=$80 would give us enough room to generate profit over a very large amount of trades.
● We wil ‘force’ our systems into a positive Risk-to-Reward ratio. Basical y we wil generate only systems with R:R equal to 1:1 and above. Note: that break-out trading is characterised by a low winning rate < 50%. In practice this means that if you ‘try’ to catch a break-out 10 times, then you wil win only 3 or 4 times and lose 6 to 7 times!
So in al cases our winning trades need to ‘cover’ for al previous losses in order to make money on average after a large amount of trades. This is THE KEY for understanding profitable break-out trading! Bottom line: our system wil ALWAYS
have much higher TakeProfit levels than StopLoss levels!
11)
Trading frequency
www.coensio.com ©2023
17


If you have careful y read and understood the last sections, you probably already know the secret formula for profitable trading, which is:
PROFIT = (diversification + low correlation + positive expectancy) * number of trades Basical y, if you know that you have lowered your risk by diversification over a large amount of trading systems and markets and you have achieved a low correlation (al system are very different) and you know that on average you have a positive expectancy (winners are bigger than losers), then the only thing missing is: generating many trades to monetize your trading portfolio (but keeping in mind not to “over-trade”), just fol owing the law of
large numbers!
You can compare managing a portfolio of automated systems to managing a few tables in a casino in Las-Vegas ;) You know that each table should have a small winning edge on a large time scale and having 2 tables is better than having 1 :) 12)
Portfolio building method
After we generate, test and select many different, robust strategies, we wil need to build our final uncorrelated portfolio. For this purpose we wil use the QA (QuantAnlayzer) tool provided together with SQX platform and we wil fol ow a FIXED set of rules while selecting our strategies! This wil be discussed in more detail in the practical part of this document.
13)
Monitoring and incubating methods
Final y, after our portfolio is launched on a demo or live account, we need to concentrate on the monitoring of our trading results! Therefore we wil :
● Monitor results for each single strategy deployed on DEMO or LIVE accounts!
● We wil use external tools like QuantAnalyzer to verify correlation. We wil periodical y perform a cross check between our backtested results in SQX/QA and our real live forward results.
● Final y, we wil put every single system in an incubation period of a few weeks (>20
trades on demo or a smal live account) in order to detect abnormal behaviour like bugs in exported SQX indicators. Note: hereby it is always better to trade on a live account using a smal contract size (micro contracts) And we wil only use incubated versions for real live trading with our ‘serious’ capital!
Important note: One thing we need to understand, that there is a large difference between a DEMO and LIVE accounts on every broker. Basical y, DEMO account results can be seen as results under almost ‘perfect’ trading conditions (fast executions, no slippage, etc…) this is a
‘trick’ brokers use to get as many people as possible into opening a LIVE account. Obviously LIVE
www.coensio.com ©2023
18



account results wil be much much worse. However, incubating on DEMO is stil a good way to tel if our strategies have a ‘winning edge’ and can ‘beat’ the market (= a good way to test your strategies 'separately’ not including al negative obstacles caused by your broker on a LIVE
account). Summarized:
● DEMO accounts: used for strategy verification under ‘almost perfect’ trading conditions
● LIVE accounts: used for smal contract sizes for incubation and final y for real / live trading. Note that smal contracts like micro-contracts have increased relative cost of trading, so every system that performs OK on a micro-contract chart wil also do wel on a mini or single contract size.
14) Patience
One of the most difficult things in algo trading is ‘waiting’ and being patient. You wil be waiting most of the time e.g.: waiting for workflow to finish its task or waiting for first incubation results. Moreover as you wil see, most of the robust systems wil be found only on time-frames (M15 and above). This also automatical y means that the strategies wil show not more than 50 trades per year on average. So be ready, your patience wil be tested!
Conclusion
As you have noticed (or not), there is stil one piece of the puzzle missing, and this is YOU
and your DEDICATION. Without dedication you wil never become a successful trader. Note that success comes with time and practice. A lot of time and practice ;) So, wil you be able to solve this puzzle? See next chapter!
The practical part (Level= basic)
This part of this document concentrates on a practical step-by-step guide that explains the complete (from A to Z) strategy building and testing process. This part assumes that traders are familiar with the theoretical part and also that the selection of algo-platform, trading
www.coensio.com ©2023
19

markets and instruments, broker and trading platform is already done. Note that everything is based on the fol owing choices:
- Algo-platform: StrategyQuant X (Build > 134)
- Markets & symbols examples:
● S&P 500: ES, MES
● NASDAQ 100: NQ, MNQ
● RUSSELL 2000 (CME): RTY, M2K
● GOLD (COMEX): GC,MGC
- Instruments: Futures (micro/mini and single contract sizes)
- Broker: Tradestation
- Trading Platform: Tradestation
Note: Why do we not provide a ready to go pre-configured StrategyQuant directory with al the settings? → To force our members to learn the required steps to prepare the historical data used for strategy generation.
TIP: About curve-fitting
We al know curve-fitting is bad! However, here is the thing:
Curve-fitted systems that are passing all imaginable robustness tests are
indistinguishable from not curve-fitted systems.
Just think about that for a moment, if I wil give you a good and robust trading system that passes al robustness tests, you wil not be able to tel if I found this system by curve-fitting it to the market or not. If you wil not be able to tel , the market wil also not be able to tel the difference. Thus we can use some level of curve-fitting to our advantage, for example by building our systems on a larger portion of our historical data (in-sample data), and reserving only some minor part for real OOS testing. Note in this scenario it wil be much easier to find long term profitable systems and our anti curve-fitting OOS validation wil be more or less entirely done on a different market!
TIP: Make your own trading journal
If you have more than one portfolio it is good practice to have some kind of document where you can write down your observations. changes, improvements. It wil help you to keep a clear overview over your trading work and you can always read back what happened at a given time in the past. It can be as simple as a text file on your desktop.
Q&A: Intra day vs mid-term swing trading?
From our experience when it comes to break-out trading on highly volatile markets, we prefer day trading systems, meaning closing our positions before the end of the day.
Hereby we also prefer no to wait until the last candle of a given trading session, but to close
www.coensio.com ©2023
20

our trade 1 candle before the actual end of the session! Doing so we are avoiding some erratic market moves at the end of the session.
Q&A: What timeframes you use?
For intraday break-out strategies: M15 and M30.
Q&A: When to tel if your trading results are worthless?
The best thing you can do is to always be ‘honest’ to yourself about your results, and sometimes it’s just better to stop than to continue on the wrong path. So here are examples of when it would be a good idea to stop your trading:
● When your workflow/ work method does not show continuation of positive results: this is something you can verify by ‘shifting’ your workflow and pretending you are living in the past (let's say two years back). Then generate a portfolio of strategies using your workflows and test them on the last two years (simulated future OOS
period). If you do not see positive results then your work method is worthless :)
● When your forward results on a DEMO account do not show any agreement with your SQX backtested results.
● When your forward results on the LIVE account are total y different than expected.
Q&A: Wil your strategy work forever? What’s the strategy expiration time?
So far after 14 months of forward trading we did not have seen any strategies that have
‘expired’ or ‘died’ (= mostly reaching a larger drawdown that historical/monte carlo expected drawdown). However, looking at the results of other (professional) traders, we can tel that break-out strategies do ‘expire’ after a period between 8 to 14 months. So this is stil something we need to monitor. In the meantime, just in case, we are ALWAYS
generating new fresh uncorrelated strategies, this process should NEVER stop!
Q&A: How to deal with costs of trading?
In most cases the major part of the cost of trading is determined by: commissions and slipaages. Depending on contract type commissions can be between $1 and $3 for most futures contracts. Example of trading costs on micro contracts:
2x exchange-execution-and-clearing-fees:
Micro E-mini Futures — $0.20 per side, per contract + NFA fee 0.02 per side/contract. = $0.4 +
$0.04 = $0.44 per round trip
2x Commissions:
CME Micro e-mini index futures for $0.50 per contract, per side, Micro E-mini Futures — $0.50
per side, per contract. = $1 per round trip
www.coensio.com ©2023
21
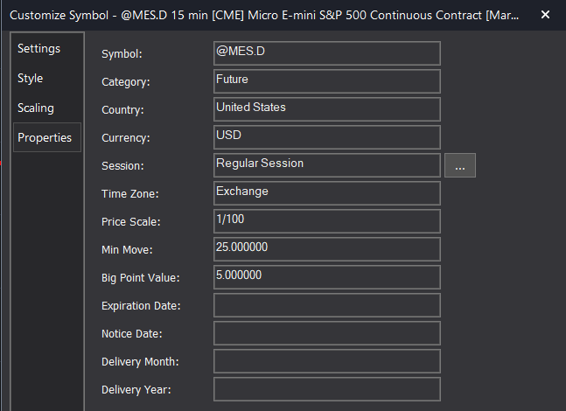

Assuming only 1x tick Slippage for high liquidity markets: 1 tick value = (1/100)*25*5 = $1.25
TOTAL COST for trading of 1 @MES contract: $0.44+$1+$1.25= $2.69
Initial margin requirement: $1210
So we need to ‘reserve’ $1210 from our current account equity in order to be able to open 1
micro contract on @MES symbol and we wil pay $2.69 for total trade costs (assuming only 1 tick of slippage). In that case we wil look for systems that show an average trade of $6 or much more in order to make sure we can cover our trading cost on the average.
Q&A: How our typical workflow looks like?
In our typical workflow we have the fol owing steps: 1. Builder
2. Improver
3. WFM optimization
4. Monte-carlo parameter test
5. Different market test (OOS)
6. WFA optimization (IS/OOS)
7. Monte-carlo trades (QA level)
In our opinion that’s al that is needed to build robust trading systems and enjoy some market profits.
www.coensio.com ©2023
22
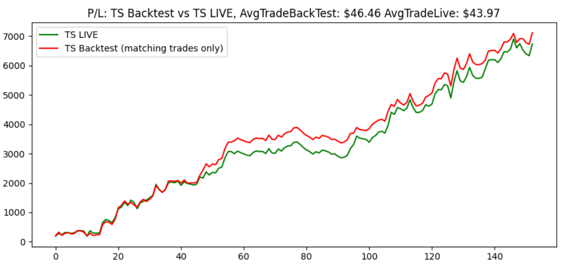

Q&A: How good is your correlation between SQX backtest and live trading?
For example:
Note: the smal visible trade “shift” is caused by our manual mistakes = human error. That's what happens when you trade during holidays ;)
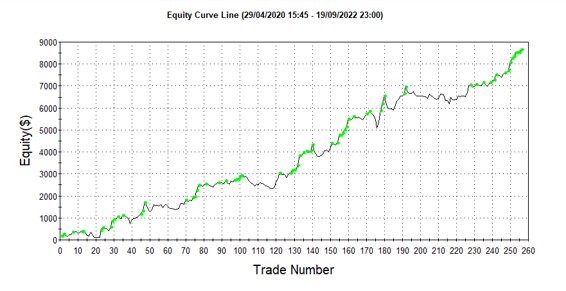
Q&A: How does a typical live equity curve look like?
For example micro contracts 2.5 years of trading:
Q&A: How to recognize a robust and potential y profitable system?
www.coensio.com ©2023
23

In short by doing your homework, and checking if the strategy meets the fol owing points:
● System passes al robustness tests
● Has a high return to drawdown ratio Ret/DD > 7 and high stability >0.75
● Has a high ‘average trade’ figure that exceeds total cost of trading
● Has a sufficient number of trades at least 40/year
● Makes profit in unseen OOS data
● Has equity curve that doesn’t ‘die’ completely when tested on data from a different market
● Has a high walk forward efficiency (WFE) figure
www.coensio.com ©2023
24


