There are several methods to fnding the very tip top of these pump and dumpers, but through experience I've discovered that nothing is better than using plain candlestick charts. Candlestick charts show price movements through “candlesticks.” These charts are very simple yet very efective in showing us when a stock is likely to fall. With candlestick charts there are diferent periods to which you can set them. You can set them up to show 2 year, 1 year, 6 months, 1 day, 30 min, 1 min, etc. What I fnd that works the best with short selling is the 6 month setup, along with a 5 min setup. I will frst chart a specifc stock using a 6 month chart. If it looks like a good short I will then chart it using a 5 min chart to see if it's losing steam and to fnd specifc price levels that indicate support and resistance. If you see a stock you want to short, it is essential to use the 5 min to pin-point the entry price. Here's a example of my chart setups(and the beginning of a classic pump and dump):
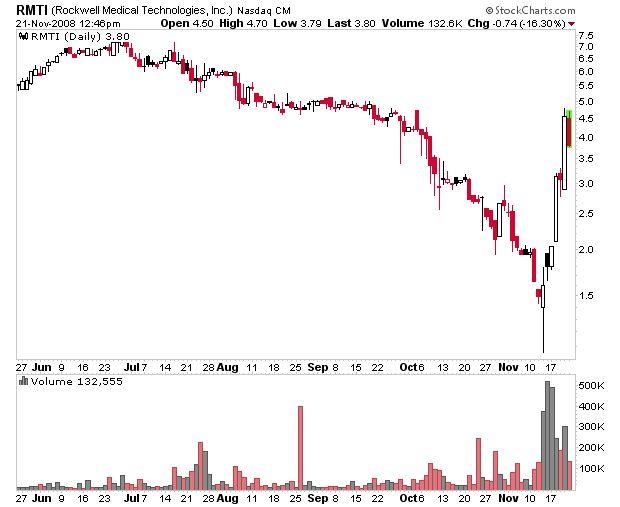 6 Month Chart