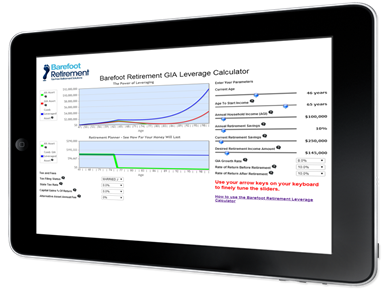
We realize that some of these concepts and programs can be a little hard to understand in the beginning. There are quite a few moving parts and variables, and if you are new to this, it can sometimes be a challenge. To help our clients understand and visualize this better, we created a customized Barefoot Retirement Calculator.
There’s no other calculator in the world like this one. Its custom made and one-of-a-kind. I have to tell you, our clients absolutely love it! Caution: This calculator can become addicting.
The Barefoot Retirement Calculator is super easy to use, and it gives you an excellent visual representation of the programs you are considering. There are three core components to it.
The first component is for seeing how your current retirement program will perform in the future. You simply plug in some simple numbers and assumptions, and it will visually show you how your money will grow and hold out before and during retirement.
The second component visually shows you how your IUL can perform based on the variables you select.
The third component is the best! It visually shows you the amazing power of leverage. This section combines your IUL and your outside investments together, and visually shows you just how powerful this combination can be.
To help you better understand how it works, let’s take a look at two different examples.
In this example, we have a 46-year-old who makes $100,000 a year. He has accumulated $250,000 in his portfolio, and puts this amount into an IUL. That’s it. He makes NO further contributions to his policy. He retires at age 65, and is then able to borrow $125,000 a year from his account, each and every single year, until age 120.
Wow. He was only making 100k a year while he was working. Now by only putting in 250k, he will be able to have a higher annual income during retirement, than he did while working. Plus… the 100k he made while working was taxable. The $125,000 a year he borrows from his policy each year is TAX-FREE. If he was in the 28% tax bracket while working, he was only netting out around $72,000 a year.
Who says that you have to downsize your lifestyle when you retire? That’s what the Barefoot Retirement Plan is all about.
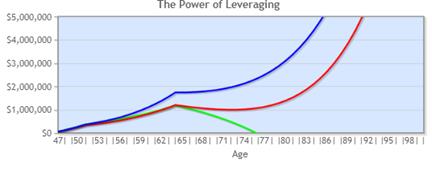
Red Line: The red line (GIA Asset), shows what your gains would have been if you ONLY invested in the IUL, the market index returns for the IUL averaged a 9% overall gain, over the years shown; you did not borrow against your policy, and you did not make any alternative investments into bucket B. You can see around age 77; the cash value of this account is over 1 million dollars, and you never run out of retirement funds.
Green Line: The green line (Alternative asset), shows what your gains would have been if you had ONLY invested in an alternative investment that averaged a 10% return over the years shown. The alternative investment could represent your IRA, 401(k) or any other investment you would have made. On this chart, you can see that the green line crashes below zero around age 77. That means, if that’s your only retirement income, you are now 77 years old and out of money. Ouch! Can you say, “Welcome to….?”
Blue Line: The blue line (Combined Leverage asset), shows the power of leverage. It shows what the total value of your account would be if you put 250k into an IUL, and then made no further contributions to your policy, AND you borrowed a loan against your policy, put the funds in bucket B, and averaged a 10% return on your bucket B investments. At age 77, your cash value is over 2 million dollars, and you never run out of retirement funds.
As you can clearly see, the power of leverage is amazing and life-changing for most people. It can make all the difference in the world to your retirement. It can make the difference between you being able to live the barefoot retirement lifestyle of your dreams, or having to work into your golden years, just to survive.
In this example, we have a 40 year-old, who makes $75,000 a year. He does a good job managing his money, and manages to save approximately 13% of his gross income, or $833 a month, which he puts into his IUL each month. We are using a 9% return on his IUL, which has been the historical average for over 24 years. Plus, he borrows against his policy and achieves a 10% return per year, in outside investments, (in his bucket B).
He decides to retire at 65 years of age. When he retires, he will be able to borrow a retirement income out of his policy of $125,000 a year, for the rest of his life! Again, it’s pretty amazing that someone who only made 75k a year while working, can achieve a lifetime retirement income of 125k a year, for life.
Plus, remember, the 125k per year is tax-free money. He gets to keep it ALL, and give none of it to Uncle Sam. He is making 67% MORE in retirement, than he was making while working.
Now, to make this even more interesting, let’s take a look at the lines on the chart below.
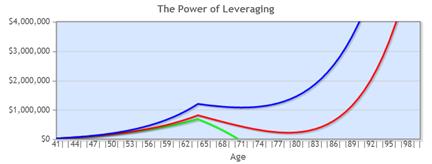
Red Line: The red line (GIA Asset), shows what his gains would have been if he ONLY invested in the IUL, the market index returns for the IUL averaged a 9% overall gain, over the years shown; if he did NOT borrow against your policy, and he did not make any alternative investments into bucket B. You can see, around age 80, is the low point. The cash value of his account at this low point is only around $200,000. However, here is the key takeaway. The red line never touches zero. That means he NEVER runs out of money during retirement. If he lives to 90, his cash value goes up to about 1.3 million.
Green Line: The green line (Alternative asset), shows what his gains would have been if he had ONLY invested in an alternative investment that averaged a 10% return over the years shown. The alternative investment could represent his IRA, 401(k) or any other investment he would have made. On this chart, you can see that the green line crashes below zero around age 71. That means, if this is his only source of retirement income, he is completely and out of money, at the no-so-old age of 71. Then what? Unfortunately, there are no good options at this point.
Blue Line: The blue line (Combined Leverage asset), shows the power of leverage. It shows what the total value of his account would be if he put $833 a month into his IUL until age 65. AND he borrowed a loan against his policy, put the funds to work in bucket B, and averaged a 10% return on his bucket B investments. Around age 71, his cash value is at its low point of over 1 million dollars. Since the blue line never touches zero, he will never run out of retirement funds, for the rest of his life.
The interesting thing here is the difference between the green, and blue line at age 71. By not using this program, he is out of money, and flat busted at the age of 71. However, if he follows the Barefoot Retirement Plan, (and if our return assumptions at least meet the return percentages we used for this analysis), instead of being broke at age 71, he would have a cash value net worth of over a million dollars, and a $125,000 annual, tax-free income, for as long as he lives. Talk about two different lifestyles, this is a pretty huge difference.
Some of you reading this may not have $833 a month to put into an IUL. Here’s the thing. What if you cut this in half? What if you only put in half as much, and if you only received half as much in retirement? That’s still pretty amazing. Or, what if you had two or three times more, to put into your IUL. Imagine what your retirement numbers would look like? Well, you don’t have to imagine. We’ll be happy to run those numbers for you for free. Just contact us and request your free analysis, and we will be happy to show it to you in vivid detail.
The two main variables in these examples are the percentage of return that the blended index will deliver in the years to come, and the percentage of return you can achieve with your outside investments in your bucket B. The blended index we most often use, has averaged a 9.24% return over the last 24 years. As you know, those have been some pretty crazy years. How will it perform in the next 25 or so years? No one knows. If it performs better, you plan will do better. If it performs worse, your plan will not perform as well. There are no guarantees of what the future holds, nor how the markets perform.
Additionally, no one knows how your outside investments will perform. You could have a low performance with your investment choices, or you could even lose all of your money. If that happens, your plan obviously would not perform as well. On the other hand, it’s possible that you could make some excellent investment choices that have outstanding returns. This would cause your plan to perform even better.
If you find that these risks are more than you would be comfortable with, perhaps this program is not for you. It’s not for everybody.
The majority of Americans are not even close to being financially prepared for retirement. They are so far behind where they need to be; it’s depressing. If they keep doing what they’ve been doing, and keep getting the same results they’ve been getting, it’s a mathematical certainty that they will not reach their retirement goals, and will not have enough funds to retire the way they plan to.
Here’s a great analogy for this. You’re sitting in your favorite chair, in your den, watching your favorite football team, play on a Sunday afternoon. They just reached the fourth quarter. Your team is behind by 27 points. Yikes. The coach has been calling running plays, for most of the day. They obviously haven’t been working so hot, against this dominant defense. You know the feeling you get, as you are screaming at the TV.
You know that if that coach doesn’t do something different, if he doesn’t change up his game-plan and playbook, if he doesn’t start calling some down-the-field passing plays, they’re going to lose this game. The clock is going to run out on them, they won’t have enough time to make up the 27 points, and they’re going to chalk up another loss on the season. You scream louder at the coach, saying something like this, “Come on man. Call some passing plays. We can win this one. Let’s get it going. Throw the damn ball, and let’s score some touchdowns….”
Some people are in a similar spot with their retirement. The clock is ticking down. There’s not much time left. If you’re going to get it done, and win the retirement game, you’re going to have to do something different. You certainly don’t want to panic, and throw caution to the wind. You don’t want to throw Hail-Mary passes on every play. You need to be smart about it. But you also need to remember Einstein’s famous quote, “Insanity is doing the same thing over and over again, and expecting different results.”
Of all of the retirement programs out there that we’ve ever seen, we’ve never seen one as powerful as this. Not even close. As you can see by running different scenarios on your Barefoot Retirement Calculator, this program does have the potential to help you make up for lost ground, win the game, and be able to retire on your own terms. However, just like the coach has no guarantees that if he changes his play calling, that he’ll win the game, neither do we. If the markets don’t perform, or if we make some bad decisions along the way, they could affect our outcome.
On the other hand, the coach probably knows, or should know, that if he keeps playing-it-safe, and calling those same running plays that haven’t worked all day, that he will lose the game. As we have said all along, retirement planning is serious business, and it should be given a great deal of thought.
We want to give you our custom built Barefoot Retirement Calculator. We’ve spent many months as well as thousands of dollars developing this tool. We want to give it to you as our gift to you, simply for taking the time to check out the Barefoot Retirement Program.
It will help you take an in-depth look at what your retirement looks like now… and what it could look like using this amazing program. It will also demonstrate the Power of LEVERAGE. You’ll be able to plug in your own numbers, your own investment amounts, your years until retirement and your own investment return assumptions. We think you’ll love it. It’s fun to run all kinds of “What If” scenarios. You’ll find it to be an eye-opener.
To Gain FREE ACCESS To Your Barefoot Retirement Calculator, Go To:
www.BarefootRetirement.com/calculator
Grab Your Free Calculator Now!