 Pillar #11 – Visitor Analysis
________________________________________________________________________
Visitor analysis is absolutely essential if you want to discover which of your
internet marketing activities is proving to be the most valuable for your business. By tracking which websites are providing you with most traffic, knowing which websites your users are visiting prior to your site, which websites they are leaving your site for, and which inbound links are providing the most valuable visitors, you can target specific areas and focus future marketing campaigns.
Here are just a few of the things that you should be finding out about your website visitors:- Where did a visitor come from?
- How long did they stay when they visited your site?
- Which page(s) did they visit on your website?
- Have they visited your site before?
- Can you improve your conversion rate?
- Did they complete a specific action on your website? (i.e. buy a product, complete a service enquiry form, download a free report) Perhaps some of your visitors opted-out half-way through an order process? Is so, that’s essential information.
Hopefully you will understand the valuable nature of this information. If you’re looking at it from a business efficiency perspective then by paying attention to which of your marketing activities is providing the most high-quality visitors, then you will know where to concentrate a lot more of your energy in the future. If you’re thinking about this from a marketing managers’ perspective, then by being aware of where your website visitors are coming from and what they do will be able to justify a greater investment in certain areas in the future.
Google AnalyticsThe most popular method of gathering good quality visitor analysis data is to use the free analysis software from Google called Google Analytics (Figure 11.1). All you need to access the Google Analytics service is to have your own free Google Account – you will already have one if you’re started a Google Adwords pay-per-click campaign.
A small number of businesses or other organization aren’t comfortable with letting Google have access to their website’s and their visitor’s data. Unless this is the case for you, there’s no reason why you shouldn’t install the Google Analytics code on your website. At least then – even if you decide to go for a paid alternative – you’ll have some alternative data to be able to compare against your preferred visitor tracking software.
Figure 11.1 – Google Analytics
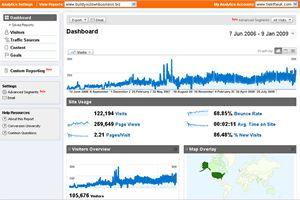 The Google Analytics Dashboard
Setting up your Google Analytics service
Having registered your website with Google Analytics, the first things to do is to insert some tracking code on the footer of each page on your site. It’s fairly easy to do – Google provides you with a step-by-step guide of how to get things going. They also provide an excellent help section should you get stuck.
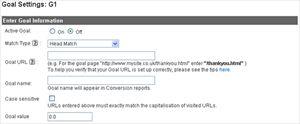
The importance of setting goals with Google AnalyticsWith regards to Google Analytics, a goal is a page on your website that follows a specific action that you want your visitors to take. An example of a goal might be something like your ‘thank you page’ that people see they once they complete an enquiry form on your website.
Figure 11.2 – Google Analytics
 Setting up a goal on Google Analytics
E.g. the path of URLs that your visitors take to reach your goal URL might look something like this:
1) http://www.yourdomain.com
2) http://www.yourdomain.com/enquiry_form.htm
3) http://www.yourdomain.com/thanks_for_completing_enquiry_form.htm
In the above example the page
http://www.yourdomain.com/thanks_for_completing_enquiry_form.htm might include the following text:
‘Thanks for filling out your information. We’ll respond to your enquiry as quickly as possible. In the meantime, have you downloaded our free report?
That is your goal page. You enter the URL of this page into your Google Analytics control panel, in your goal settings. You then give your goal a name so you can differentiate it if / when you set up additional goals.
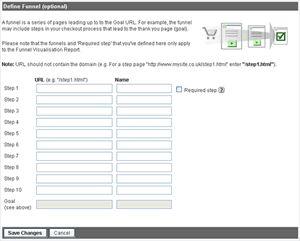
Define your goal funnelOnce you’ve decided on your goal page, and taken a note of your goal URL you’ll need to do something called ‘defining your goal funnel’ (figure 11.3).
Defining your goal funnel tells Google Analytics the path from your visitor entrance page to your goal page. Defining your funnel will help you determine if there is any specific part of the path towards your goal page at which your visitors tend to drop off.
An example of a simple goal funnel is the above URL path which looks at someone when they enter your site on your home page, then visiting an enquiry form page, through to completing the enquiry form and therefore visiting the ‘thank you for completing your details’ page.
A slightly more complicated goal funnel path might be as follows:
- Your website home page
- Category page
- Product page
- Upselling page
- Purchase confirmation page
- Credit card details page
- Thank you for purchasing page
 Defining your goal funnel on Google Analytics
Analyzing your funnel blockages
Once you have defined your funnel you can analyze which steps of your funnel are blockages – in other words which steps of your funnel people stop at and for whatever reason do not proceed any further.
Figure 11.4 – Google Website Optimizer
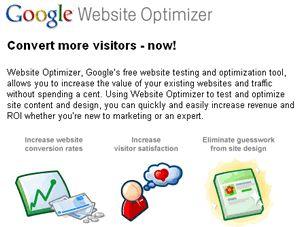 The sign-up page on Google Website Optimizer
Perhaps it’s not obvious what your shipping charges are? Maybe people would like to see a better picture of your product before they make a decision to purchase? Perhaps you’re requesting too much information when you’re asking people to complete an enquiry form? Whatever it is it’s your job to try and find out what the main problem areas are on your website and defining accurate funnels of Google Analytics can help you do this.
Plugging your funnel leaksBut remember, determining the problem is only half the job. There’s no point in working out where people are leaving your goal funnel unless you do something to try to plug the leaks.
Probably the best way to try to improve the situation is to split-test the aspect that isn’t performing too well against an alternative option. Google’s recently introduced some software called Google Website Optimizer (figure 11.4) which will allow you to split-test different aspects within the same page at the same time.
Set a monetary value for each of your goalsOne other essential aspect of setting a goal is setting a monetary value for the goal. You can enter a monetary value at the bottom of your goal settings (see bottom of figure 11.2). This value is how much it’s worth to your business if a website visitor completes the Google Analytics goal in question.
What do you mean you don’t how much the people who complete your Google Analytics goals are worth to your business financially!?If you don’ know exactly how much the people who complete your Google Analytics goals are worth you your business financially then you need to take an educated guess. Because if you don’t include a monetary value then a lot of the reports that Google Analytics can produce for you won’t be available.
Taking an educated guess on how much completed goals are worth to youIf you don’t know exactly, it’s important to take an educated guess as to how much people who complete your Google Analytics goals are worth to you financially. So how do you guesstimate this value? If we assume that we’re talking about a completed enquiry form as a goal, then you should already know how many people who complete your enquiry form go on to make a purchase. And you should also know the average order value for your business.
Therefore, for example, if for every 20 people that enquire about your service one person buys, and that your average transaction value represents £1,000 profit then you know that each person who enquires about your product or service is worth £50 to you, so your goal value will be £50.
Next – work out your conversion rates to determine your advertising budgetThe next thing to work out is your conversion rates from someone visiting your home page to completing your enquiry form. You should be able to easily get this figure from your Google Analytics stats – assuming that you’ve set up your goal correctly.
Say you see that 2% of your website visitors go on to complete your enquiry form. Because you’ve already determined that each of your completed goals is worth £50 to you, that means that you know that, on average, each new website visitor is worth £1 to your business.
Therefore if you decide to pay for some website traffic in the future, you have a good idea of how much you can afford to pay for the advertising.Knowing where you are now gives you something to aim for in the future
The great thing about knowing that a completed goal is worth an average of £50 profit to your business and that 2% of your website visitors go on to reach this goal is that it gives you something to aim for – it means that you can turn your focus towards improving your average transaction profit value and increasing your visitor to goal conversion rates.
Increasing your goal conversion rates could be incredibly important for your business. For example, if you can increase your average goal conversion rates from 2% to 4%, then this in turn increases your average visitor value from £1 to £2.
This increase in average visitor value may well open up your access to thousands of more visitors. If your average visitor value increases, so does your ability to pay more for traffic, meaning that you will have access to bigger networks of paid traffic sources.
Have you inserted your Google Analytics tracking code on your website yet?Of course all this talk about improving your goal conversion rates is pointless unless you’ve inserted your Google Analytics tracking code on your website and set up your goals – so if you haven’t done this already, do it now!
Figure 11.5 – Google Analytics
 Looking at www.BuildYourOwnBusiness.biz traffic sources using Google Analytics
Insert the Google Analytics tracking at the bottom of each page on your site (if you can’t figure out how to do this yourself any website coder will find it fairly simple to do). This isn’t as time consuming as you would think – most pages on your website will have what is called a common footer which is replicated on all the pages. This common footer means the code only has to be pasted in one place for it to be automatically included on every page on your site - allowing you to track visits to individual pages.
By setting goals and tracking your visitors you can determine which aspects of your internet marketing campaign are most successful, and which aspects aren’t working so well. It’s extremely important to undertake this analysis to optimize the success of your internet marketing campaign.
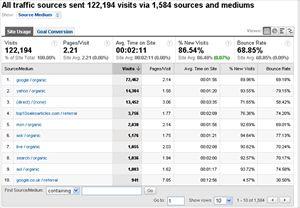
Looking at an example of stats on Google AnalyticsUsing the website www.BuildYourOwnBusiness.biz as an example (figure 11.5) you can see that over a set period of time, 122,194 website visits have been referred from 1,584 traffic sources.
The same screenshot shows that the average visitor viewed 2.21 pages and spent 2 minutes and 11 seconds on the site. You can get a lot more information about your visitors from Google Analytics including which country they’re from and what browser they’re using to view your web pages.
You can also see in figure 11.4 that 86.54% of the website visits were from people who hadn’t been to the website before – and that 68.85% of visitors left the website before choosing to view another page (that’s called the bounce rate).
Although these stats are encouraging in terms of the quantity of visitors, it’s a bit concerning that so many people are choosing to leave the website after viewing just the one page. It’s even more concerning that only 13.46% of visitors choose to come back and visit the website again.
Here you see the advantage of using a good visitor tracking system like Google Analytics. Unless you’re aware of the statistics that you could improve on, there’s very little chance that you’ll know which changes to implement on your website to try to change things for the better.
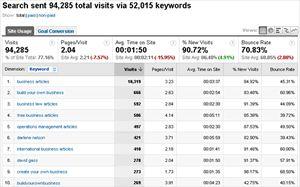
Keyword PhrasesSomething else that Google Analytics allows you to do is to analyze the keyword phrases that people are using to find your website in search engines. By reviewing which keyword phrases have been driving the most traffic to your website through search engines (Figure 11.6), you’ll be able to see how successful your search engine optimization strategy has been so far.
As you can see in figure 11.6, the most successful keyword phrase by far is ‘business articles’, the phrase that has driven over 10,000 visits from search engines. The next best keyword phrase has driven just 666 visits.
On the face of it, this isn’t good. If you rely too heavily on traffic from just the one keyword phrase, then if search engines – for whatever reason – decide to rank your website in a lower position for that keyword phrase then you may take a big hit on the overall amount of visitors to your website.
Figure 11.6 – Looking at keyword phrases on Google Analytics
 Looking at the keyword phrases driving traffic from search engines in Google Analytics
Fortunately though, this isn’t the case for the www.BuildYourOwnBusiness.biz website. If you look more closely at figure 11.5 you can see that although 10,319 visits have been generated via the keyword phrase ‘business articles’, this is from a total of 94,285 visits. The ‘business articles’ keyword phrase therefore represents just under 11% of all the organic (free traffic as apposed to pay per click) visits from search engines.
The extremely positive thing from an organic SEO perspective for this website is the quantity of different keyword phrases which are driving traffic. 52,015 different keyword phrases have referred website visits.
You can also see that the category pages are well optimized. For instance, the keyword phrase ‘business law articles’ referred 592 visits, ‘free business articles’ referred 506 visits and ‘operations management articles’ referred 497 visits.
This provides a very important lesson – if you just focus on optimizing for just the one keyword phrase, and just the one page (i.e. your home page) then even if you manage to hit the top of Google for your chosen keyword phrase, the chances are that you’ll still be missing out on 90% of your potential search engine traffic because you haven’t considered longer-tail keyword phrases.
Broadening the quantity of keyword phrases that people use to find your website in search engines has an additional benefit. Not only will you be driving more visitors to your site, you’ll also be safeguarding your traffic from search engines. In short, the more routes into your website, the less you risk having your business seriously affected if you lose the high search engine ranking of ne keyword phrase.
Analyzing traffic from links to your siteYet another important use of visitor analysis software like Google Analytics is to analyze the quantity and quality of traffic driven to your site directly from links as opposed to search engines.
By selecting ‘traffic sources’ and then ‘referring sites’ in Google Analytics you can view all the different websites that are driving traffic to your site.From there you can click on one of the listed links and drill down further. If the website that you’re analyzing sent traffic from multiple pages, you’ll be able to see which pages sent the most traffic. You’ll also be able to analyze the quality of traffic from each individual page that sends you traffic. For instance, some websites may send you traffic which on average views many more pages. Other website many send you visitors that are much more likely to convert to your Google Analytics goal target.
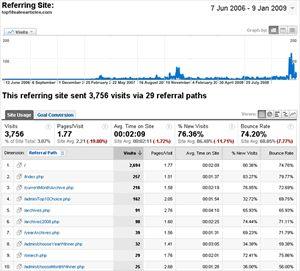
Reviewing the quality of traffic from Top10SalesArticles.comBy reviewing the quality of traffic delivered from the website Top10SalesArticles in Google Analytics (Figure 11.7) we can see how much better (or worse) traffic from an individual link is compared with other sources.
For instance, we can se that the average amount of time that a visitor from this site spends on the BuildYourOwnBusiness website is 2 minutes and 9 seconds. This compares with an average of 1 minute and 50 seconds from traffic from search engines.
Figure 11.7 – Google Analytics
 Reviewing the quality of traffic from Top10SalesArticles
You can also see that the bounce rate of traffic from this site is slightly higher – 74.20% compared with a bounce rate of 68.85% from all traffic.
These statistics are interesting, and information about the quality of the landing page can be inferred from the data. For instance, it could be argued that the quality of the home page on the BuildYourOwnBusiness website isn’t encouraging enough visitors to click through and view other pages – it therefore needs to be improved.
Not all traffic to your website is equalThis little exercise of reviewing the differences in website traffic to BuildYourOwnBusiness from varying sources shows that it’s important for you to be aware that not all traffic to your website is equal.
If you are fully aware of the quality of traffic delivered from a certain website – including how much on average each visitor is worth to you, you may be able to justify an increased affiliate referral fee for that website. Visitor value knowledge is power.
This again emphasizes how important it is to set up a monetary value with your Google Analytics goals. Unless you include this, you’ll find it a lot harder to differentiate between the value of traffic from different sources – and therefore much harder to make highly informed future marketing spend decisions.
Can you list the top 10 websites that refer traffic to your website? If so, what have you done to try to increase the volume of traffic from these sources?Is your website as clearly laid out as it should be?
Something else that’s really important to consider is the pages that your visitors tend to view on your website – for instance, is there a link from your home page which tends to be visited more than any other? If so, you need to know why.
Perhaps you’re website’s as not as clearly laid out as it needs to be. Check how long people stay on their second page for. If’ it’s only a manner of seconds then you should question the value and relevance of the information on that page.
Have you tested your website in different browsers?Check if there’s any significant difference between people who view your web pages in less common web browsers. If you notice any major difference then you should do some usability testing – test that your site performs and looks just as good in different scenarios.
That’s why testing your site before you start marketing it to the general public is so very important. You can put off quite a few visitors if your website doesn’t display properly in Firefox or Safari. It’s easy to forget that just because you might be using Windows and Internet Explorer to view your web pages, many of your visitors might not be.
Website coding is an art as well as a science. In other words, there’s not necessarily a logical reason why certain parts of your web page might look significantly different, or act in a significantly different manner when viewed through different devices. I recall that for several months a major UK supermarket’s website just didn’t work properly at all when viewed through the FireFox browser. That meant that they may have alienated 30% of their website visitors simply because their website wasn’t thoroughly tested!
Mobile browsing devicesDepending on the technical profile of your audience, you may find that a significant percentage of your website visits come through mobile internet devices. Do you know what your website looks like in a mobile phone? How quickly does it load? Do people viewing your web pages on mobile phones have to scroll before being able to read anything worthwhile?
If being able to view and operate your website from a mobile phone is important for your business (or likely to become important for your business in the future) then you should consider having a special version of your site designed for these devices with less images and straight-to-the-point text.
Don’t guess – make an informed decisionThere really isn’t any excuse for guessing when it comes to improving your website for your visitors. Analyzing the statistics from your current visitors should provide you with all the information that you require to make an informed decision to improve things.
And even if you’re not entirely sure, you should use that split-test software which I mentioned earlier (Google Website Optimizer) to test different improvement options. Thorough website visitor analysis is a must if you want your website to reach anywhere near its full potential.
Pillar #11 – Visitor Analysis Summary• Using Google Analytics you can track many vital visitor statistics like where your visitors come from and how long they stay. You can then use this valuable information to find weak spots in your website like improving important conversion rates.
• Once you have identified your weak spots or discovered a blockage on the site you can amend your website to improve your conversion rates. This is probably something that your competitors aren’t doing.
• You can track the sources of traffic to your site, and more specifically which websites your visitors are coming from, as well as keyword phrases used in search engines to find your site. You can use this to help you determine which keyword phrases to focus on in the future for your SEO.
• Remember that it’s imperative to set goals for your site – and give them a monetary value.• Make sure you test what your website looks like and performs like on different browsers – this includes mobile phone browsers.
• Don’t delay on getting your visitor tracking set up – unless you set it up now, you won’t have any comparable historical data to analyze in the future.
• Use Google Analytics to help you pinpoint the most valuable sources of traffic to your site – you might be able to make a decision that you can afford to pay more for traffic from certain sources if you can justify it.
• How can you justify any future marketing spend unless you track its performance. Online marketing is unique – the majority of it is entirely trackable and therefore justifiable.
• For links to the various websites mentioned in this pillar and up-to-date visitor analysis resources visit http://www.13pillars.com/resources/pillar11.