Chapter 5
Trading strategies
As you learn to trade currencies, you will not only follow popular strategies, but will also end up developing your own methods over time. These will suit your particular investment style and temperament as well as goals. However, till then, in this chapter, we will look at the 5 popular strategies that work for short and long term trading and for a variety of investor types.
Support and Resistance Trading
Support and resistance are barrier levels for the price of a currency. These levels are evident on all FX charts across time frames, with the most influential levels retaining their position even years after they were first created. Many traders will set automatic trades for when these levels are reached or breached. Typically, a resistance line eventually becomes a support line as it is breached and the price continues to move higher, but does not break through the new resistance level.
Support and resistance trading can be done over the short or the long term and one can use technical as well as fundamental factors in conjunction with support and resistance levels. This strategy works well for the trader with the mentality to plan his trades and who likes to keep his risks to the minimum. The Fibonacci retracement tool is the most popular indicator for support and resistance trading since it clearly identifies these levels.
Using support and resistance levels for currency trading
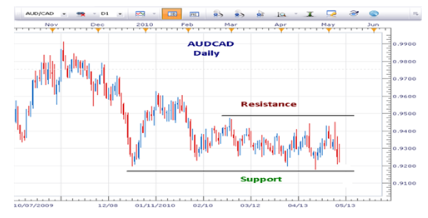
Resistance and support levels can help a trader to effectively predict the price movement of the currency. Not only are the support and resistance areas used as a cue to the market sentiment, but also these can be used to pinpoint when to enter or exit the trade. In simple words, support and resistance levels create a map of where the prices had previously bounced or reversed. Take a look at the charts below to understand support and resistance better
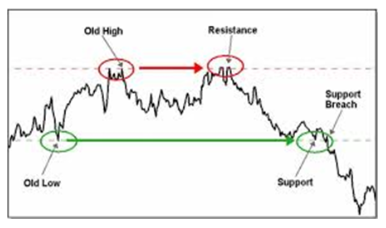
As you can see in the image above, the resistance level is essentially a ceiling that the price seems to touch but does not go through, instead coming down to the support level. Once again, the green support line is not usually breached, but when the price does go through, it continues to fall for some time.

The theory behind support and resistance levels
The support level is where the number of buyers exceeds the sellers. As the price plunges, the sellers find it less and less profitable to liquidate their positions. At one point, the selling activity stops, which is why the price does not go through the support. The exact opposite happens when it comes to the resistance level.
As the price is reaching up to the resistance levels, there is more demand or more buyers in the market for the currency, but as the price keeps climbing, it becomes less and less profitable for the buyers to continue buying. At the resistance levels, there are more sellers than the number of buyers, which prevents a breakout or the prices from breaching the resistance level.
Unless new data is available, which will send the rates soaring or plunging, the price remains range bound- that is it fluctuates between these two levels. Every time, it reaches up to the resistance level, after touching the line it comes right down to hit the support level or at least gets close to it and then goes right back up. A breach of the resistance levels means that if the price has gone through, the buyers are willing to pay more for the currency and will continue to do so.
When it comes to the support level, a breakout would mean that the sellers are willing to sell lower and will continue the trend. If this happens, the support level that has been breached becomes the new resistance level. As a general rule, the longer the support and
resistance levels have been held, the stronger they will be. So, these levels reflected on the daily chart will be much more sustained as compared to those seen on the 1-hour chart.
The most effective ways to use support and resistance to trade currencies
There are several ways in which support and resistance levels can be used in trading. One of the simplest strategies involving these levels is for tough traders who will simply place a reversal order at these levels. The belief supporting this move is that once the market reaches these critical levels, the price will reverse or at least retrace, giving them a profitable trade.
Candlestick: Doji trading
Long before technical analysis made it to the Western shores, the Japanese were using it successfully since the 17th century for commodity trading. Candlestick charts are visually more appealing and easy to interpret. Also, they offer more information than the regular bar chart.
As the name suggests, the chart itself is made of several candlesticks in green and red, green is the bullish candle, indicating that the market closed higher than its opening and the red is the bearish candle, which shows that the close was lower than the opening. The candle also has upper and lower wicks/shadows, which show the highest and the lowest price reached during that trading session.
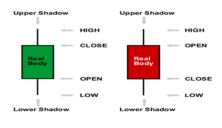
The real body is the difference in the opening and the closing price. So, if the difference between the opening and closing is significant, the candle stick will have a long rectangular body, while if the difference is less, it turns almost square like or even into a single line, like in the case of the doji. The color of the candlestick is immaterial as you could use any that you like. The norm is to go for green and red or a combination of white and black.
The Doji
This is an extremely important candlestick formation, one that shows that a trend reversal may be imminent. These doji can provide information on their own as well as when made part of important patterns. Take a look at the image below to see doji formations.
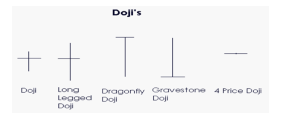
The doji is formed when the opening and the closing prices are nearly the same, which leads to the formation of a thin horizontal line instead of the body of the candlestick. The wick or the shadow can be of different lengths, leading to the formations shown above.
On its own, a doji is a neural pattern, but a strong bullish or bearish bias can be formed on the basis of what comes before and after the doji formation. It should be noted that a doji with equal open and close is considered to be the most robust. A doji is a sense of indecision on the part of the buyers and the sellers. However, it shows that neither the bulls nor the bears could gain control of the market, but a turning point is on the cards.
Doji and Trend
After a long bullish, green or white candlestick, a doji signals that the buying pressure is diminishing while with a long bearish candlestick, the doji signifies that the selling pressure is starting to weaken. The emergence of the doji indicates that the supply and demand are balancing each other out.
However, you will need further confirmation to ascertain a trend reversal, which is why the next candlestick after the doji ought to be observed closely. Take a look at the candlestick chart below to see how the doji works:
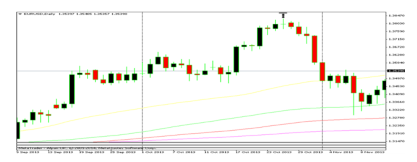
You will find that the most robust doji formation occurs on Oct 23rd and subsequently there is a strong trend reversal. If a trader were to short a currency at this point, significant profits could be made over the next few days. The doji works well for intraday trading and it is well suited to the investment style of traders who rely on technical trading more than the fundamentals.
Scalping
This is a very short term strategy in which the trader makes a profit on the movement of a few cents in the price of a currency. This means that the positions are held for a relatively short period of time and a single investor may end up conducting dozens or more such trades in a day. Scalping is all about finding the perfect entry and exit position.
This is the right strategy for highly disciplined traders who will enter the market with a plan and will sell at a predetermined point no matter how inclined they are to keep the position. Also, contrary to popular perception, scalping may not lead to high trade volumes. In other words, there is no fixed number of trades that you must conduct; you can trade as much or as little as you like.
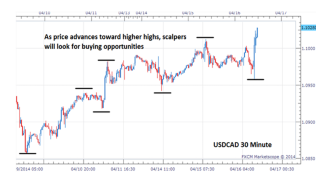
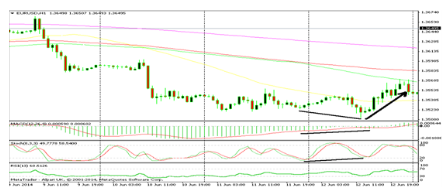
In this particular strategy, the USCAD 30 minute chart is used, but traders may also incorporate, MVA, Fibonacci retracement, pivot points and others in their strategy. Take a look at the chart below; this is a USCAD 30 minute, you will see that the pair shows an overall uptrend, and it is making higher highs and higher lows. Notice the black horizontal lines and how they keep moving higher.
Going for the right entry
Generally, scalpers will either follow a breakout strategy or a retracement strategy to determine the entry and exit points. For example, in an uptrend like the one for USCAD, the traders will wait for a pull back to sell at a high price and subsequently exit the position by buying at a lower price. However, those who are following the breakout strategy will wait for the price to break through a key resistance level and form a higher high.
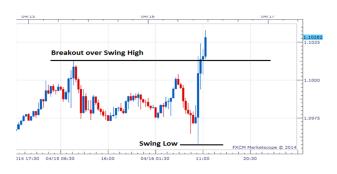
The chart below shows two points which can be used for market entry. First when the price forms a higher low, this is the signal of a retracement and can be used as an opportune entry point. The second is when the USD/ CAD breaks out above the previous weeks high; this would also be a good indication for traders to speculate in the direction of the trend.
Candlestick and divergence
At this point, you already know about candlestick charting which forms the cornerstone of technical analysis. We also learnt about the doji formations and what they stand for. Now, let us take this one step further and understand the meaning of divergence and its use in trading strategy.
As the term indicates, divergence means a deviation. This is a leading indicator that can help to make significant profits when used correctly. Traders will often use Moving Averages, Support and Resistance levels and others to spot divergence and determine the right entry point in the right direction.

Typically, the actual price and the indicators are supposed to go in the same direction. By this definition, if the price is reaching higher highs, the indicator is supposed to follow suit, also making higher highs. The same logic holds for lower lows and higher lows.
However, if for some reason the price and the indicator readings do not correlate, this is a signal for an impending change. Take a look at the image below to understand what a divergence looks like. The bar chart above is for the price of the asset while the image below is that of the indicator.
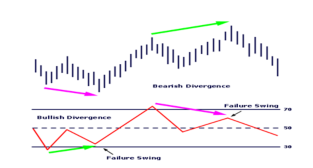
Divergence can be seen in four distinct forms:
Regular Bullish Divergence
This indicates a trend reversal. In the chart below, notice how the candlestick chart for EUR/USD (1 hour) shows that the price is making lower lows, but both the stochastic and the MACD do not correspond to this, showing higher lows. This points to a trend reversal, which is shown by the strong black arrow.
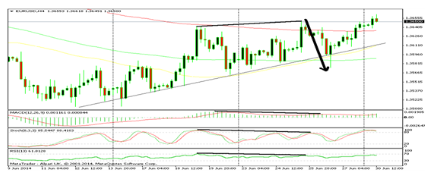
Regular Bearish Divergence
Take a look at the 4 hour chart, the price made a high in one week and followed this with a higher high in the next week. However, the 3 indicators below were all making lower highs. This is known as regular bearish divergence and it stands for a price plunge to come. Since, the chart shows an uptrend here, a retracement is what should be expected.
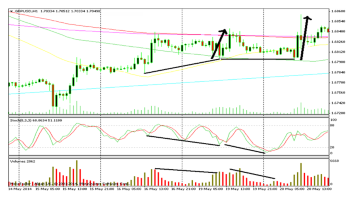
Hidden Bullish Divergence
The hidden bullish formation is indicative of trend continuation unlike the regular bullish. The 1 hour GBP/ USD chart shows two points at which the price was higher or held steady but the indicators made lower lows. This divergence signals that the retracement is at its end and that the trend will continue.
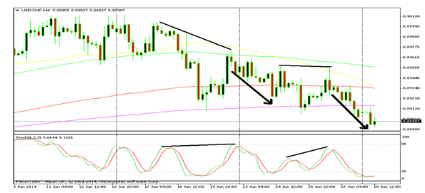
Hidden Bearish Divergence
The hidden bearish also stands for trend continuation as seen in the 4 hour USD/CHF chart. Notice how the stochastics were heading close to the overbought levels and once the divergence occurred the prices fell almost immediately to continue their downward spiral.
Divergence trading works best for people who want to find low risk entry and exit points, so it would be safe to suggest that this is a strategy for the cautious trader who wants to minimize his losses.
Forex Binary options
Binary options are a class of derivatives which are called exotics. However, don’t let the name fool you; they are quite simple actually as they have all or nothing expiry points. These derivatives can be used as a powerful tool to minimize risks. Hence, the binary options strategy for forex investments works particularly well for traders who want to play it safe.
A binary option has several features which mimic regular “plain/vanilla” options. They have an expiration date, a strike price and the premium that one has to pay for putting on the position. The most notable difference here is that binary options have a fixed payoff. This means that your payoff will be $0 if the rate of the currency does not hit the strike price and it will be a fixed amount (say $50 or $100) if your expectation is right and the rate does reach the strike price.
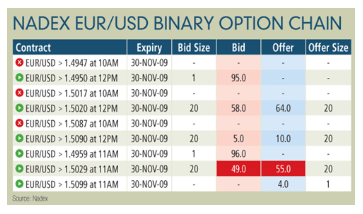
Binary FX options for the following currency pairs are offered on the North American Derivatives Exchange (NADEX); EUR/USD, USD/CAD, USD/JPY, USD/CHF and GBP/USD. The expiration on these derivatives can be chosen from intraday, daily or weekly. Binary options are also available with hourly strike rates; these form a potent substitute for stops.
Using binary options instead of stops
In this strategy, instead of putting stops at above or below the highs and lows of the previous day or the Bollinger bands, the trader uses binary options. Once again, this is a cautious strategy, akin to buying insurance to cover a calamity that may or may not occur, and this is how the whole thing works.
Given the fact that the trader has already determined that the daily ATR (Average True range) of the EUR/USD is at 147 pips while the weekly ATR stands at more than 300 pips, it is obvious that the markets are bound to be volatile and see wide price swings. This leads to a higher probability of being stopped out.
To prevent this, instead of using stops which do offer protection, binary options are used, so that the trader is rebated when the market moves against his position. Let us consider an options contract that pays out $100; this is 10 pips on a standard lot of $100,000.

If the trader is holding a long/short position on the EUR/USD, binary options can be purchased to hedge the position. Assume that the trader shorts the pair, on a standard lot at 9 am for 1.4970. However, instead of putting a stop loss in place, he simply buys an 11 am binary option that pays $100 for a strike rate of 1.5020. This is bought for a price of $20.
This means that if at 11 am the price goes above the strike rate, the trader makes $100. At this point, another binary option can also be bought to hedge further against price reductions. If he buys 5 options contracts, he would be completely hedged. This would get him a net gain of $400 ($100-$20 X 5) versus the loss of $500 that he would experience in the spot market. In the end, his net loss would just be $100, which is 10 pips and that would be a low cost for protection.
Buying binary options is an effective way to protect yourself when the market reverses against you. It will help you to stay in position if you believe that the reversal was only temporary. However, you will need to time your entry and exits accurately to use binary options for maximum benefits.