In this chapter, you will learn to:
Graph a linear equation.
Find the slope of a line.
Determine an equation of a line.
Solve linear systems.
Do application problems using linear equations.
Equations whose graphs are straight lines are called linear equations. The following are some examples of linear equations:
2x−3y=6, 3x=4y−7, y=2x−5, 2y=3, and x−2=0.
A line is completely determined by two points, therefore, to graph a linear equation, we need to find the coordinates of two points. This can be accomplished by choosing an arbitrary value for x or y and then solving for the other variable.
Graph the line: y=3x+2
We need to find the coordinates of at least two points.
We arbitrarily choose x=−1, x=0, and x=1.
If x=−1, then y=3(−1)+2 or −1. Therefore, (–1, –1) is a point on this line.
If x=0, then y=3(0)+2 or y=2. Hence the point (0, 2).
If x=1, then y=5, and we get the point (1, 5). Below, the results are summarized, and the line is graphed.
X | -1 | 0 | 1 |
Y | -1 | 2 | 5 |
Graph the line: 2x+y=4
Again, we need to find coordinates of at least two points.
We arbitrarily choose x=−1, x=0 and y=2.
If x=−1, then 2(−1)+y=4 which results in y=6. Therefore, (–1, 6) is a point on this line.
If x=0, then 2(0)+y=4, which results in y=4. Hence the point (0, 4).
If y=2, then 2x+2=4, which yields x=1, and gives the point (1, 2). The table below shows the points, and the line is graphed.
x | -1 | 0 | 1 |
y | 6 | 4 | 2 |
The points at which a line crosses the coordinate axes are called the intercepts. When graphing a line, intercepts are preferred because they are easy to find. In order to find the x-intercept, we let y=0, and to find the y-intercept, we let x=0.
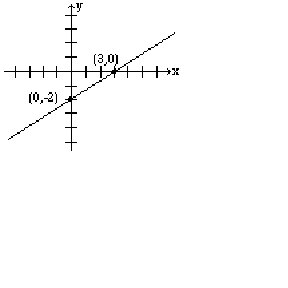
Find the intercepts of the line: 2x−3y=6, and graph.
To find the x-intercept, we let y=0 in our equation, and solve for x.
Therefore, the x-intercept is 3.
Similarly by letting x=0, we obtain the y-intercept which is -2.
If the x-intercept is 3, and the y-intercept is –2, then the corresponding points are (3, 0) and (0, –2), respectively.
In higher math, equations of lines are sometimes written in parametric form. For example, x=3+2t, y=1+t. The letter t is called the parameter or the dummy variable. Parametric lines can be graphed by finding values for x and y by substituting numerical values for t.
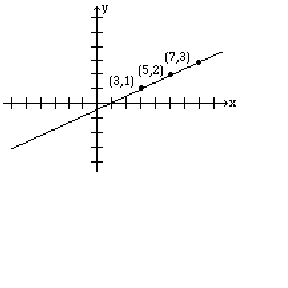
Graph the line given by the parametric equations: x=3+2t, y=1+t
Let t=0, 1 and 2, and then for each value of t find the corresponding values for x and y.
The results are given in the table below.
t | 0 | 1 | 2 |
x | 3 | 5 | 7 |
y | 1 | 2 | 3 |
When an equation of a line has only one variable, the resulting graph is a horizontal or a vertical line.
The graph of the line x=a, where a is a constant, is a vertical line that passes through the point ( a, 0). Every point on this line has the x-coordinate a, regardless of the y-coordinate.
The graph of the line y=b, where b is a constant, is a horizontal line that passes through the point (0, b). Every point on this line has the y-coordinate b, regardless of the x-coordinate.
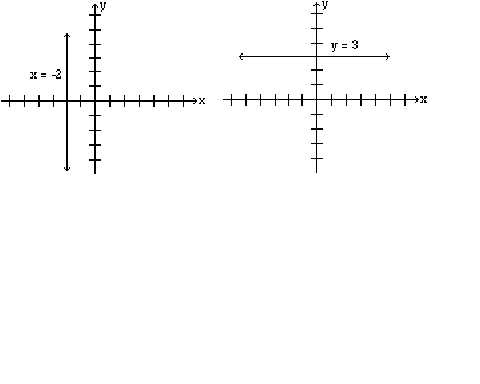
Graph the lines: x=−2 , and y=3.
The graph of the line x=−2 is a vertical line that has the x-coordinate –2 no matter what the y-coordinate is. Therefore, the graph is a vertical line passing through (–2, 0).
The graph of the line y=3, is a horizontal line that has the y-coordinate 3 regardless of what the x-coordinate is. Therefore, the graph is a horizontal line that passes through (0, 3).
Most students feel that the coordinates of points must always be integers. This is not true, and in real life situations, not always possible. Do not be intimidated if your points include numbers that are fractions or decimals.
In this section, you will learn to:
Find the slope of a line if two points are given.
Graph the line if a point and the slope are given.
Find the slope of the line that is written in the form .
In the last section, we learned to graph a line by choosing two points on the line. A graph of a line can also be determined if one point and the "steepness" of the line is known. The precise number that refers to the steepness or inclination of a line is called the slope of the line.
From previous math courses, many of you remember slope as the "rise over run," or "the vertical change over the horizontal change" and have often seen it expressed as:
We give a precise definition.
If ( x1, y1) and ( x2, y2) are two different points on a line, then the slope of the line is
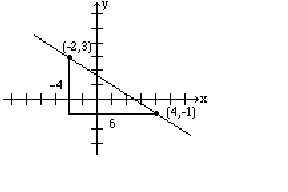
Find the slope of the line that passes through the points (-2, 3) and (4, -1), and graph the line.
Let (x1,y1)=(−2,3) and (x2,y2)=(4,−1) then the slope
To give the reader a better understanding, both the vertical change, –4, and the horizontal change, 6, are shown in the above figure.
When two points are given, it does not matter which point is denoted as (x1,y1) and which (x2,y2). The value for the slope will be the same. For example, if we choose (x1,y2)=(4,−1) and (x2,y2)=(−2,3), we will get the same value for the slope as we obtained earlier. The steps involved are as follows.
The student should further observe that if a line rises when going from left to right, then it has a positive slope; and if it falls going from left to right, it has a negative slope.
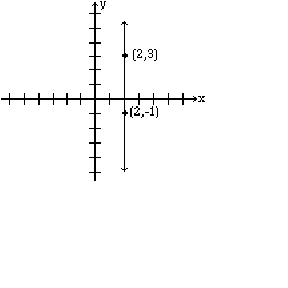
Find the slope of the line that passes through the points (2, 3) and (2, -1), and graph.
Let (x1,y1)=(2,3) and (x2,y2)=(2,−1) then the slope