Chapter 10. Factor Analysis: Part II

This chapter is published by NCPEA Press and is presented as an NCPEA/Connexions publication "print on demand book." Each chapter has been peer-reviewed, accepted, and endorsed by the National Council of Professors of Educational Administration (NCPEA) as a significant contribution to the scholarship and practice of education administration.
| John R. Slate is a Professor at Sam Houston State University where he teaches Basic and Advanced Statistics courses, as well as professional writing, to doctoral students in Educational Leadership and Counseling. His research interests lie in the use of educational databases, both state and national, to reform school practices. To date, he has chaired and/or served over 100 doctoral student dissertation committees. Recently, Dr. Slate created a website (Writing and Statistical Help) to assist students and faculty with both statistical assistance and in editing/writing their dissertations/theses and manuscripts. |
| Ana Rojas-LeBouef is a Literacy Specialist at the Reading Center at Sam Houston State University where she teaches developmental reading courses. Dr. LeBoeuf recently completed her doctoral degree in Reading, where she conducted a 16-year analysis of Texas statewide data regarding the achievement gap. Her research interests lie in examining the inequities in achievement among ethnic groups. Dr. Rojas-LeBouef also assists students and faculty in their writing and statistical needs on the Writing and Statistical Help website.
|
After clicking on Extraction, the following screen should now be present.
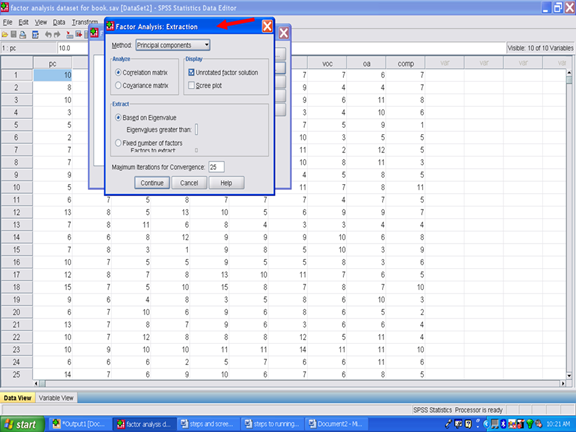
Under Display, click on Screen plot.
Unclick the Unrotated factor solution.
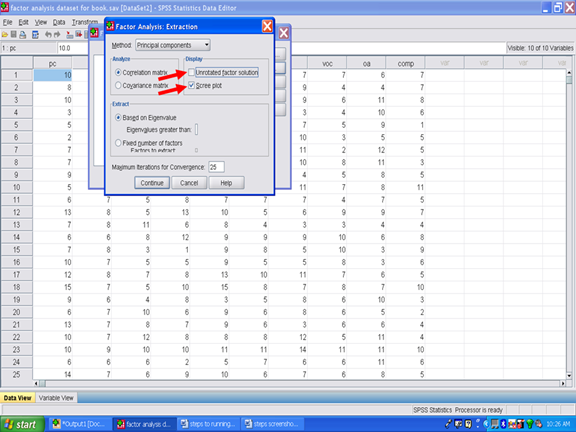
Click on Continue.
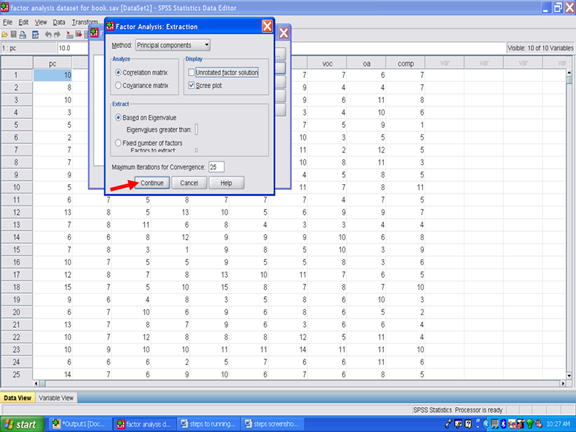
After clicking on Continue, the screen below should be present.
Now click on OK.
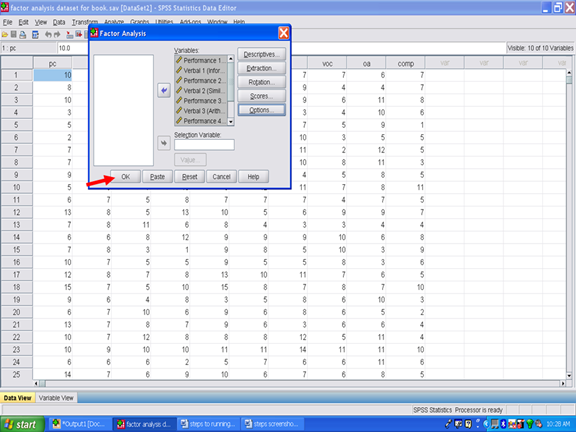
You should now have factor analysis results. If SPSS does not send you to your output screen, click on the Output icon at the bottom of your screen.
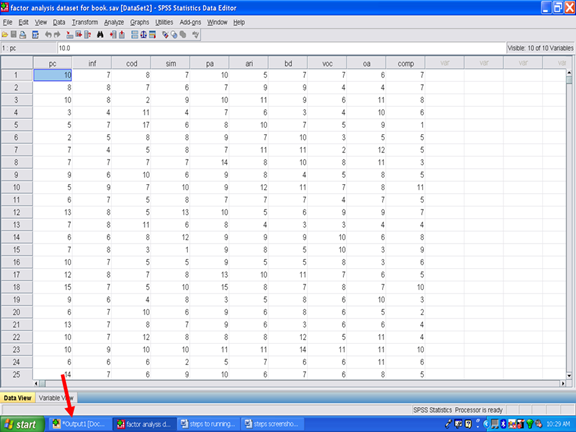
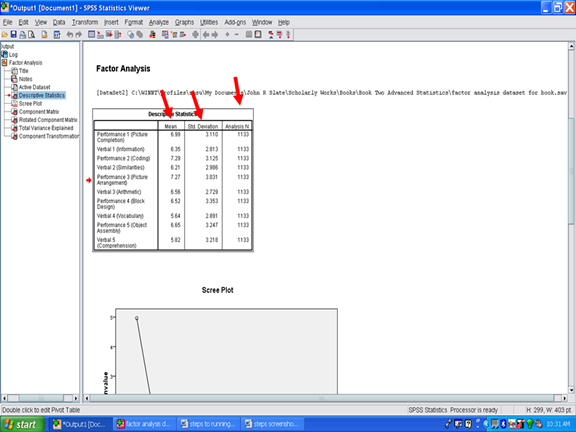
In your SPSS Output screen, the first table of importance is the Descriptive Statistics table. The sample size (n), M, and SD for each of the 10 subscales used in the factor analysis are present in this table.
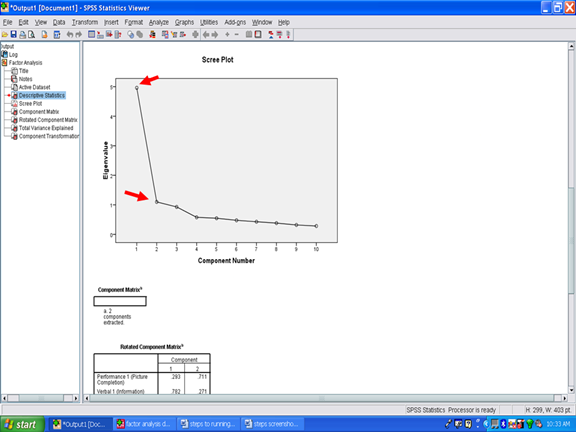
Underneath the Descriptive Statistics table is the Scree plot. What the scree plot does is to plot the eigenvalue against the factor number (Cattell, 1966; Zwick & Velicer, 1986). The eigenvalue and factor number are present in the table labeled Total Variance Explained. You will note in the Scree Plot below that the line is essentially flat after the second factor. This plot below depicts the presence of two possible factors, 1 and 2.
In the Total Variance Explained table, statistical information that is depicted in the Scree Plot is presented. The column labeled Total reflects the eigenvalues for the two factors. To determine the number of factors you may have: look at the eigenvalue column. All factors with values less than 1 are considered to be statistically insignificant and are disregarded (Kaiser, 1958). Thus, an eigenvalue of at least 1.0 must be present for a factor to be possible. In the Total Variance Explained table below, two factors are present with eigenvalues greater than 1.00: Factor 1 has an eigenvalue of 3.545 and Factor 3 has an eigenvalue of 2.515.
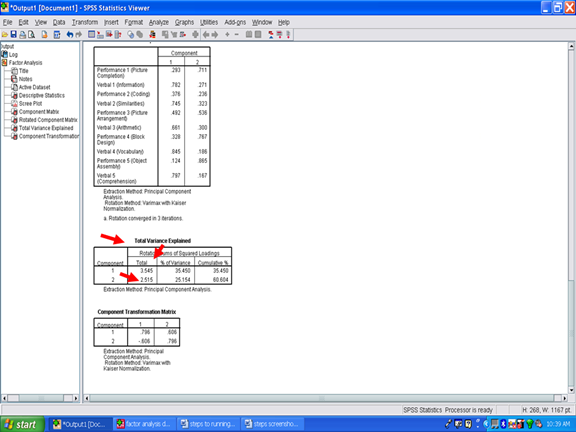
After checking the eigenvalues to ensure that they are greater than one (Kaiser, 1958), the percent of variance must be examined. To constitute a viable factor, the factor should account for at least 5 percent of the variance to be used. In the example below, Factor 1 accounts for 35.45% of the variance and Factor 2 explains 25.15% of the variance. In both cases, the factors account for much more than the minimum 5%. Together these two factors account for 60.60% of the variance.
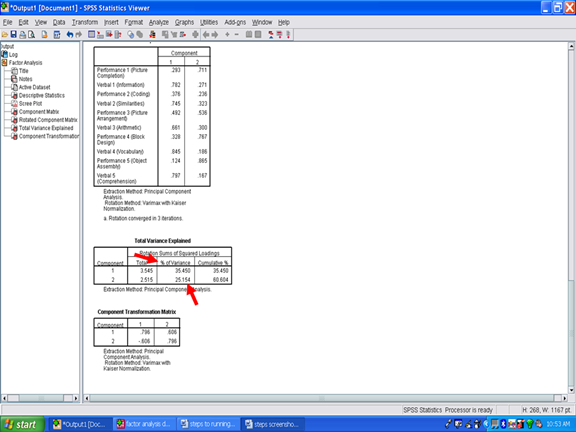
Next we will examine the Rotated Component Matrix. This table contains the factor loadings or pattern/structure coefficients for the 10 subscales analyzed in this Varimax procedure. To determine whether a subscale is a component of a specific factor, a cutoff value of .3 (Lambert & Durand, 1975) is recommended as an acceptable minimum value for pattern/structure coefficients. In this example, Verbal 1 (Information) has a pattern/structure coefficient of .782; Verbal 1 (Similarities) of .745; Verbal 3 (Arithmetic) of .661; Verbal 4 (Vocabulary) of .845; and Verbal 5 (Comprehension) of .797. Though above the cutoff of .3, Performance 2 (Coding), Performance 3 (Picture Arrangement), and Performance 4 (Block Design) are well below the coefficients for the Verbal subscales.
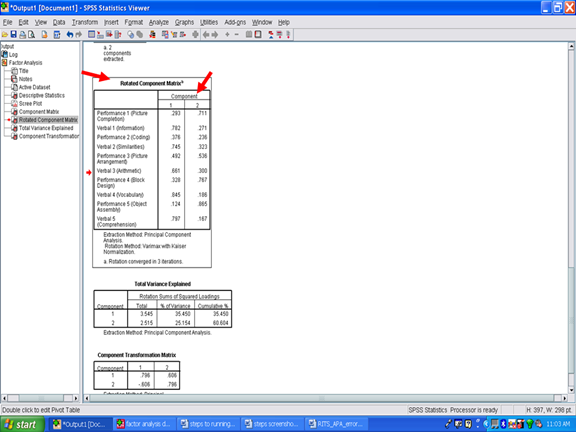
For Factor 2, the pattern/structure coefficients were .711 for Performance 1 (Picture Completion); .536 for Performance 3 (Picture Arrangement); .767 for Performance 4 (Block Design); and .865 for Performance 5 (Object Assembly). Two of the Verbal subscales were at or above the cutoff value of .3, however, their pattern/structure coefficients were markedly lower than the ones for the four Performance subscales mentioned above.
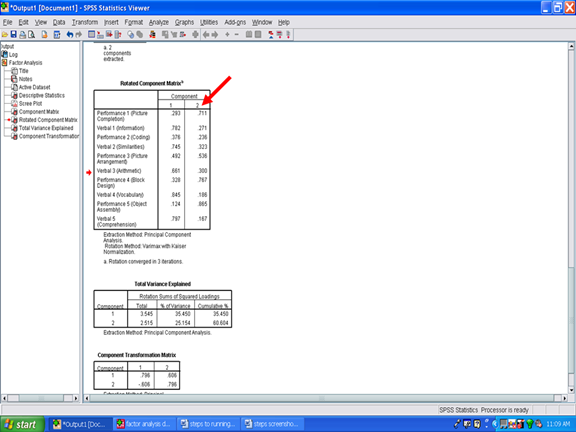
In this example, it appears that the Performance 2 (Coding) subscale is not part of Factor 2. It may be a component of Factor 1.
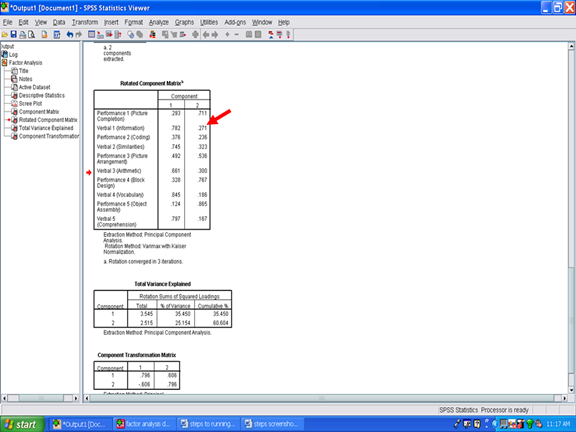
You have now conducted a Varimax factor rotation of the 10 subscales of the Wechsler Intelligence Scale for Children-Third Edition. To determine whether your factors are internally consistent, you would need to perform an internal consistency analysis for the subscales that constitute Factor 1 and a separate internal consistency analysis for the subscales that constitute Factor 2. See our chapter on steps and screenshots for conducting internal consistency analyses.
| Cattell, R. B. (1966). The scree test for the number of factors. Multivariate Behavioral Research, 1, 245–276. |
| Kaiser, H. F. (1958). The varimax criterion for analytic rotation in factor analysis. Psychometrika, 23, 187–200. |
| Lambert, Z. V., & Durand, R. M. (1975). Some precautions in using canonical analysis. Journal of Market Research, 12, 468–475. |
| Zwick, W. R., & Velicer, W. F. (1986). Comparison of five rules for determining the number of components to retain. Psychological Bulletin, 99, 432–442. |


