Chapter 7. Discriminant Analysis: Part III

This chapter is published by NCPEA Press and is presented as an NCPEA/Connexions publication "print on demand book." Each chapter has been peer-reviewed, accepted, and endorsed by the National Council of Professors of Educational Administration (NCPEA) as a significant contribution to the scholarship and practice of education administration.
| John R. Slate is a Professor at Sam Houston State University where he teaches Basic and Advanced Statistics courses, as well as professional writing, to doctoral students in Educational Leadership and Counseling. His research interests lie in the use of educational databases, both state and national, to reform school practices. To date, he has chaired and/or served over 100 doctoral student dissertation committees. Recently, Dr. Slate created a website (Writing and Statistical Help) to assist students and faculty with both statistical assistance and in editing/writing their dissertations/theses and manuscripts. |
| Ana Rojas-LeBouef is a Literacy Specialist at the Reading Center at Sam Houston State University where she teaches developmental reading courses. Dr. LeBoeuf recently completed her doctoral degree in Reading, where she conducted a 16-year analysis of Texas statewide data regarding the achievement gap. Her research interests lie in examining the inequities in achievement among ethnic groups. Dr. Rojas-LeBouef also assists students and faculty in their writing and statistical needs on the Writing and Statistical Help website.
|
The third table in the SPSS output for this canonical discriminant analysis is the Stepwise Statistics table. In this example, five of the 10 variables differentiated boys from girls.
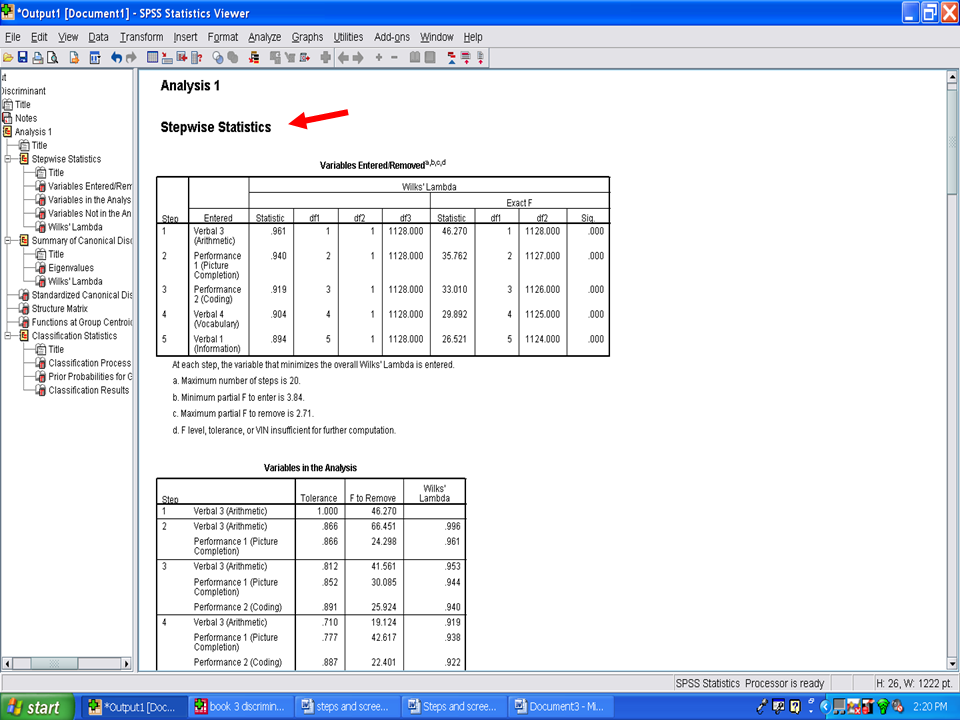
The next two tables indicate which variables remained in the discriminant analysis and which variables were not utilized. The variables that were not utilized did not contribute statistically significantly to differentiating boys from girls. The process of identifying variables in the analysis and variables not in the analysis is depicted for each of the five steps.
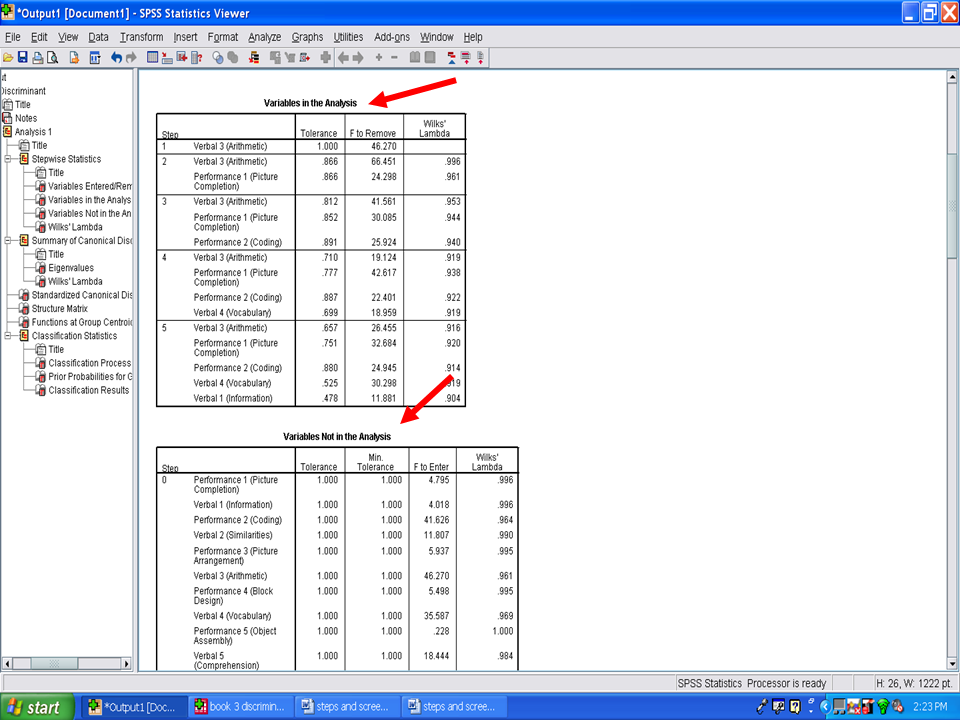
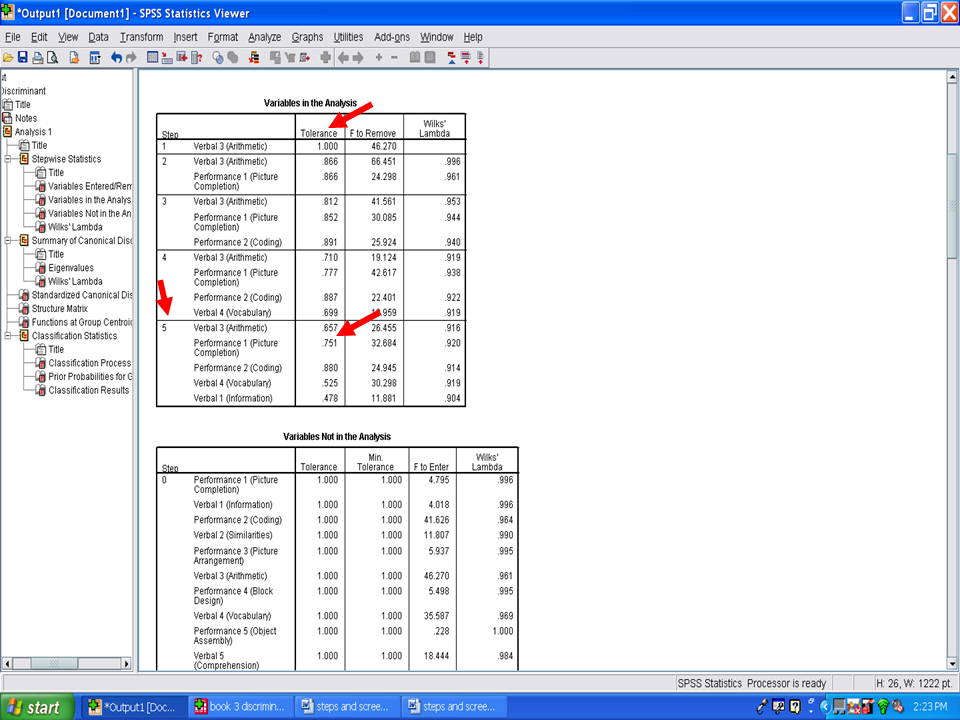
If you recall from the beginning of this chapter, one of the assumptions underlying use of a discriminant analysis procedure is tolerance values. The closer to 0 the tolerance values are, the more likely it is that the matrix is ill-conditioned and that overlap exists among the variables in the equation. In Step 5 below, you will note that all of the tolerance values are above 0, ranging from a low of .478 for Verbal 1 (Information) to a high of .880 for Performance 2 (Coding). Therefore, this assumption has not been violated.
Under the Wilks’ lambda table is a Summary of Canonical Discriminant Functions table labeled Eigenvalues. In this table is the canonical correlation, or Rc, which in this example is .325. This Rc value reflects the correlation between the groups and the discriminant function formed by the five variables that were statistically significant. The Rc may be interpreted as a Pearson correlation of the discriminant scores with the grouping variable. This information will be reported in your Results section.
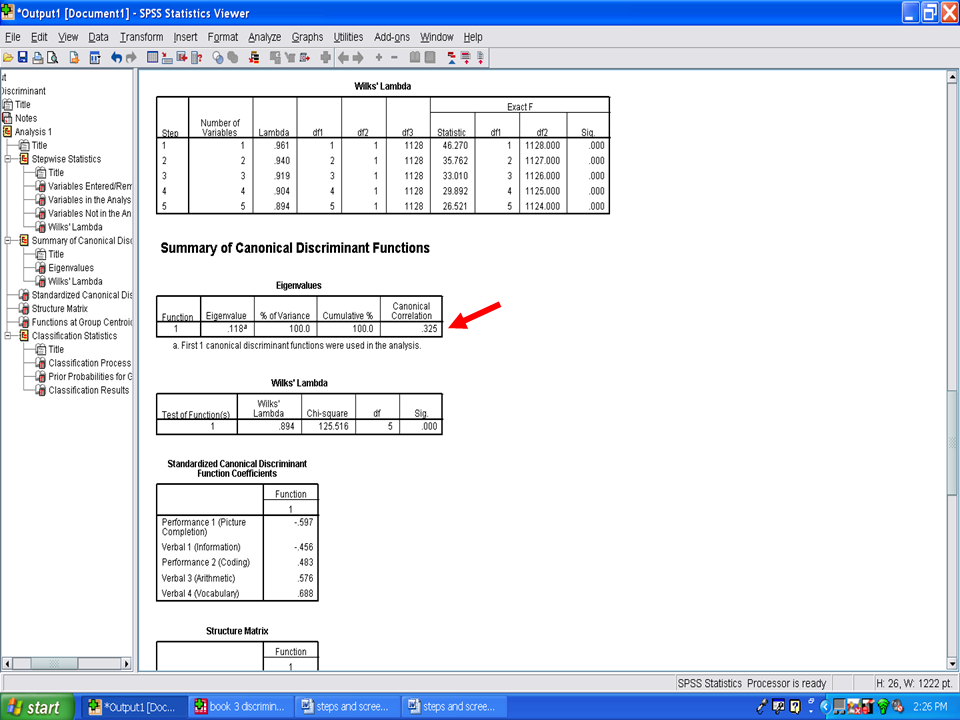
In the table below the Eigenvalues one is a table labeled Wilks’ Lambda. This measure is what is used to determine whether the discriminant function is statistically significant in differentiating group membership. In our example, the Wilks’ Lambda of .894 is statistically significant at the .001 level. This result means that the discriminant function, consisting of five variables, statistically significantly differentiated the group of boys from the group of girls. This information will be reported in the Results section.
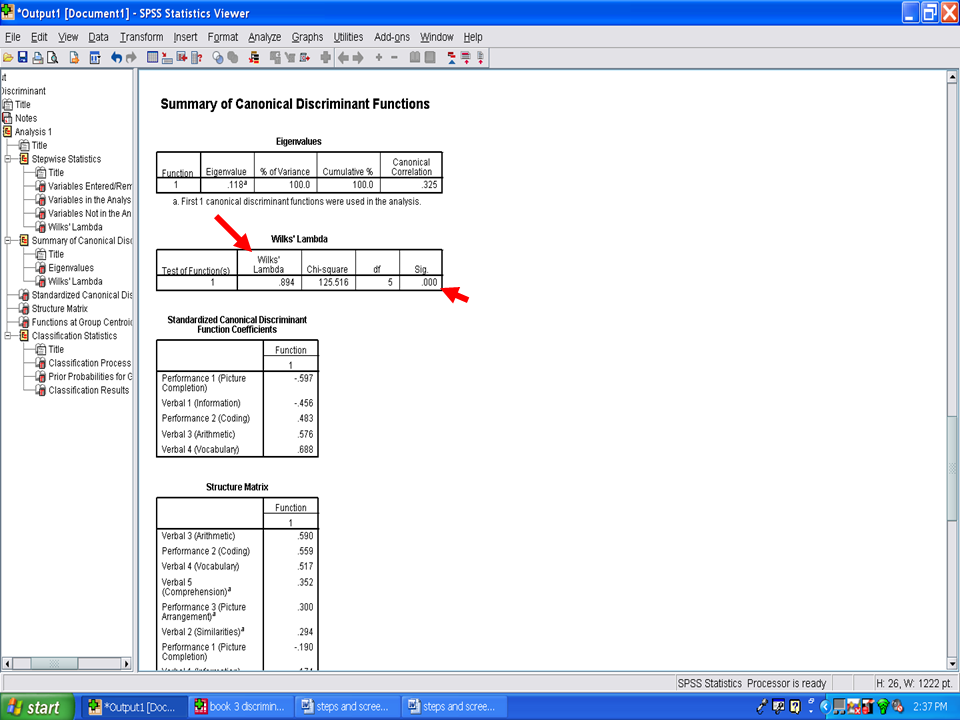
The table immediately below the Wilks’ Lambda table is labeled Standardized Canonical Discriminant Function Coefficients. These values are also referred to as Standardized Discriminant Coefficients. Contained in this table are the values that depict the relative importance of each variable in differentiating group membership. These coefficients are comparable to Beta Weights in multiple regression. In this example, Verbal 4 (Vocabulary) is more important, with a coefficient of .688, than is Performance 2 (Coding), with a coefficient of .483, in differentiating boys from girls. These coefficients should be provided in your Results section.
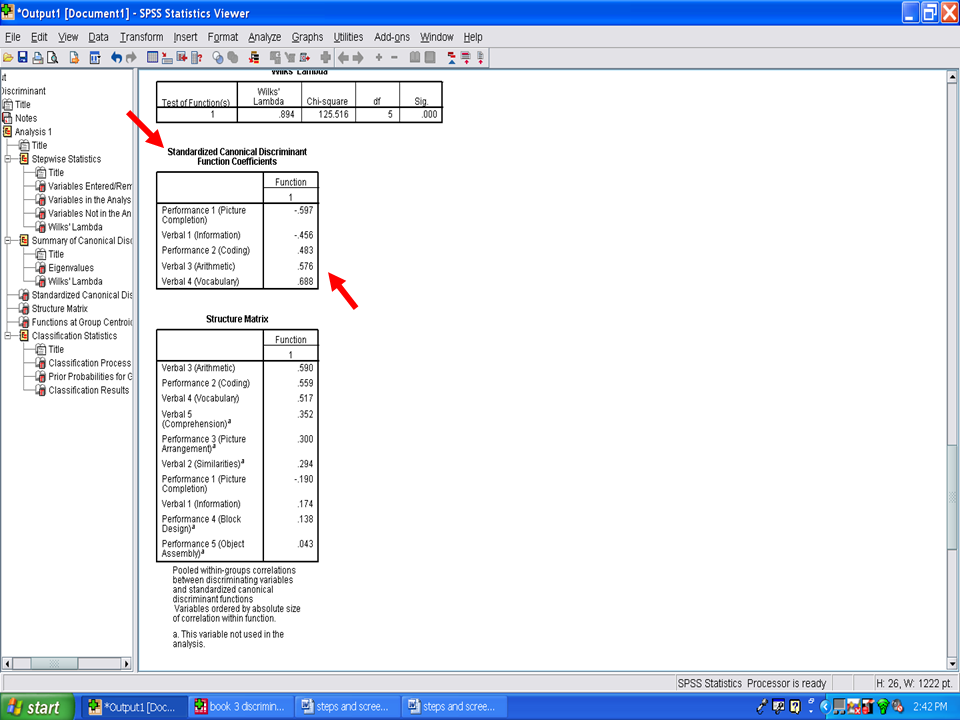
Next, we examine the table underneath the Standardized Canonical Discriminant Function Coefficients, the one labeled as Structure Matrix. Each of these values depicts the relationship of that variable with the discriminant function scores. Each value is analogous to a correlation coefficient. In the example below, Verbal 3 (Arithmetic) has a correlation of .59 with the discriminant function scores. Similarly, Performance 2 (Coding) and Verbal 4 (Vocabulary) have correlations of .559 and .517, respectively, with the discriminant function scores. These values may be interpreted as factor loadings in assigning a name to the discriminant function. As such, the first three variables just mentioned contribute more to the discriminant function than does the variable of Performance 5 (Object Assembly).
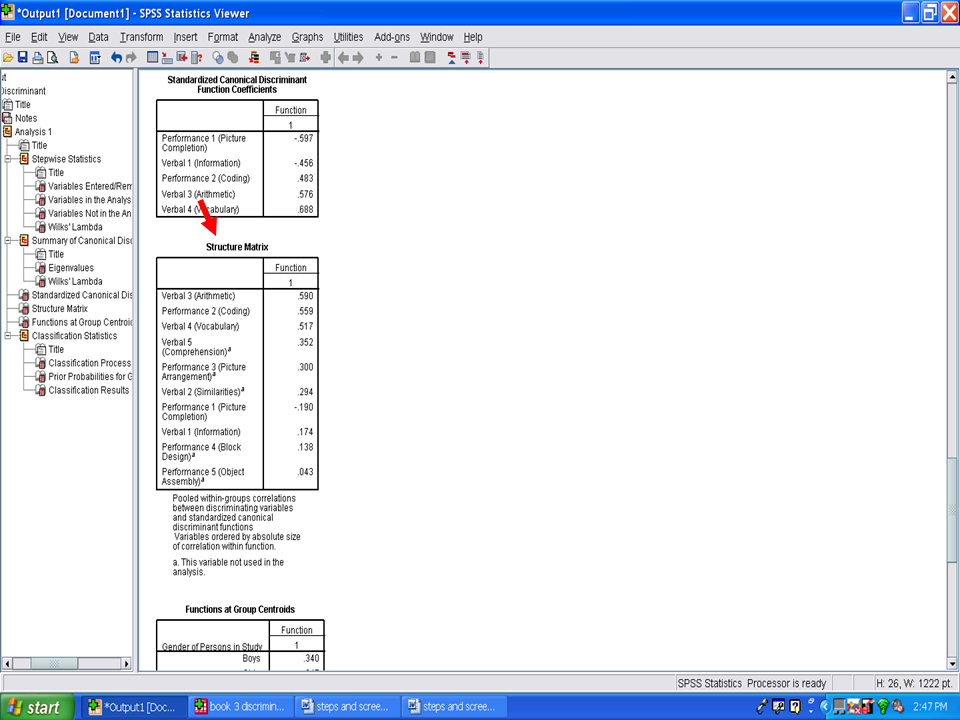
Under this table is a table labeled Functions at Group Centroids. These values are z-scores, with a M of 0 and a SD of 1. The group centroid indicates the most typical location of any person from a particular group. For this example, the group centroid for boys is .34 and the group centroid for girls is -.347. Using these values we can compare how far apart boys and girls are differentiated by the statistically significant discriminant function in our example. The further apart these two means or centroids are, the better the separation or differentiation between the two groups. The centroids should be reported in the Results section.
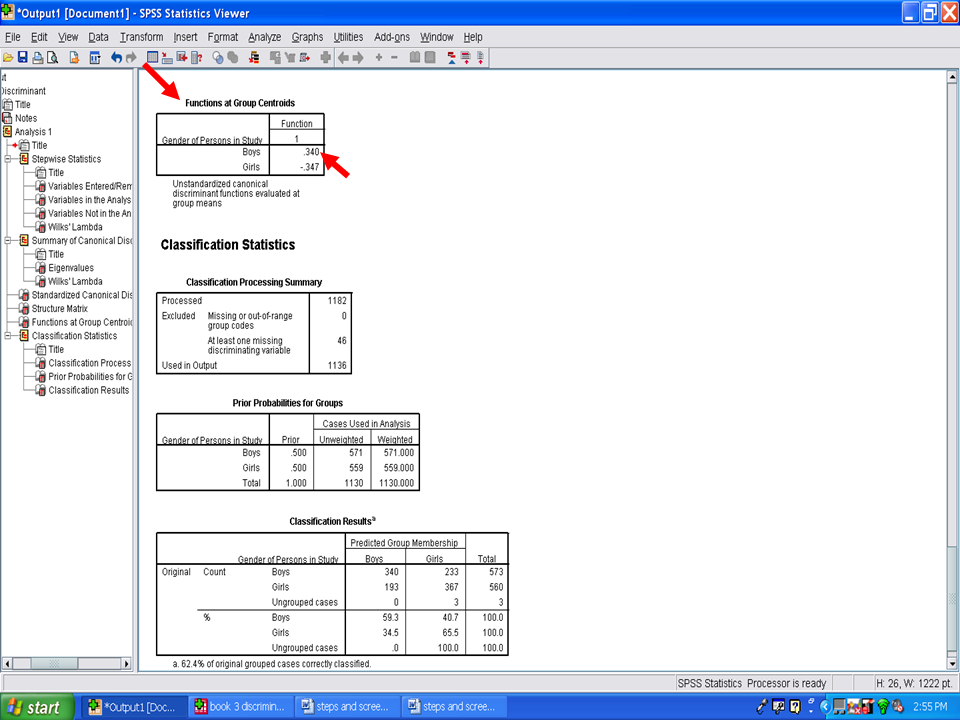
You have now successfully conducted a canonical discriminant analysis.


