
This chapter has been peer-reviewed, accepted, and endorsed by the National Council of Professors of Educational Administration (NCPEA) as a significant contribution to the scholarship and practice of education administration. Formatted and edited in Connexions by Theodore Creighton and Brad Bizzell, Virginia Tech, Janet Tareilo, Stephen F. Austin State University, and Thomas Kersten, Roosevelt University.
This chapter is part of a larger Collection (Book) and is available at: Calculating Basic Statistical Procedures in SPSS: A Self-Help and Practical Guide to Preparing Theses, Dissertations, and Manuscripts
Slate and LeBouef have written a "companion book" which is available at: Preparing and Presenting Your Statistical Findings: Model Write Ups
| John R. Slate is a Professor at Sam Houston State University where he teaches Basic and Advanced Statistics courses, as well as professional writing, to doctoral students in Educational Leadership and Counseling. His research interests lie in the use of educational databases, both state and national, to reform school practices. To date, he has chaired and/or served over 100 doctoral student dissertation committees. Recently, Dr. Slate created a website Writing and Statistical Help to assist students and faculty with both statistical assistance and in editing/writing their dissertations/theses and manuscripts. |
| Ana Rojas-LeBouef is a Literacy Specialist at the Reading Center at Sam Houston State University where she teaches developmental reading courses. She recently completed her doctoral degree in Reading, where she conducted a 16-year analysis of Texas statewide data regarding the achievement gap. Her research interests lie in examining the inequities in achievement among ethnic groups. Dr. Rojas-LeBouef also assists students and faculty in their writing and statistical needs on the website Writing and Statistical Help. |
| Theodore B. Creighton, is a Professor at Virginia Tech and the Publications Director for NCPEA Publications, the Founding Editor of Education Leadership Review, and the Senior Editor of the NCPEA Connexions Project. |
| Brad E. Bizzell, is a recent graduate of the Virginia Tech Doctoral Program in Educational Leadership and Policy Studies, and is a School Improvement Coordinator for the Virginia Tech Training and Technical Assistance Center. In addition, Dr. Bizzell serves as an Assistant Editor of the NCPEA Connexions Project in charge of technical formatting and design. |
| Janet Tareilo, is a Professor at Stephen F. Austin State University and serves as the Assistant Director of NCPEA Publications. Dr. Tareilo also serves as an Assistant Editor of the NCPEA Connexions Project and as a editor and reviewer for several national and international journals in educational leadership. |
| Thomas Kersten is a Professor at Roosevelt University in Chicago. Dr. Kersten is widely published and an experienced editor and is the author of Taking the Mystery Out of Illinois School Finance, a Connexions Print on Demand publication. He is also serving as Editor in Residence for this book by Slate and LeBouef. |
In this set of steps, readers will calculate either a parametric or a nonparametric statistical analysis, depending on whether the data for the dependent variable reflect a normal distribution. A parametric statistical procedure requires that its data be reflective of a normal curve whereas no such assumption is made in the use of a nonparametric procedure. Of the two types of statistical analyses, the parametric procedure is the more powerful one in ascertaining whether or not a statistically significant difference, in this case, exists. As such, parametric procedures are preferred over nonparametric procedures. When data are not normally distributed, however, parametric analyses may provide misleading and inaccurate results. According, nonparametric analyses should be used in cases where data are not reflective of a normal curve. In this set of steps, readers are provided with information on how to make the determination of normally or nonnormally distributed data. For detailed information regarding the assumptions underlying parametric and nonparametric procedures, readers are referred to the Hyperstats Online Statistics Textbook at http://davidmlane.com/hyperstat/ or to the Electronic Statistics Textbook (2011) at http://www.statsoft.com/textbook/
For this parametric dependent samples t -test to be appropriately used, at least half of the standardized skewness coefficients and the standardized kurtosis coefficients must be within the normal range (+/-3, Onwuegbuzie & Daniel, 2002). Research questions for which dependent samples t-tests are appropriate involve asking for differences in a dependent variable by group membership (i.e., only two groups are present for t-tests and, in this case, must be connected). The research question, “What is the effect of a reading intervention program on science performance among elementary school students?” could be answered through use of an dependent samples t-test.
| Compute Measures of Normality for the Dependent Variable |
| √ Analyze |
| * Descriptive Statistics |
| * Frequencies |

| √ Move over the dependent (outcome) variable |

| √ Statistics |
| * Skewness [Note. Skewness refers to the extent to which the data are normally distributed around the mean. Skewed data involve having either mostly high scores with a few low ones or having mostly low scores with a few high ones.] Readers are referred to the following sources for a more detailed definition of skewness: http://www.statistics.com/index.php?page=glossary&term_id=356 and http://www.statsoft.com/textbook/basic-statistics/#Descriptive%20statisticsb |
| To standardize the skewness value so that its value can be constant across datasets and across studies, the following calculation must be made: Take the skewness value from the SPSS output and divide it by the Std. error of skewness. If the resulting calculation is within -3 to +3, then the skewness of the dataset is within the range of normality (Onwuegbuzie & Daniel, 2002). If the resulting calculation is outside of this +/-3 range, the dataset is not normally distributed. |
| * Kurtosis [Note. Kurtosis also refers to the extent to which the data are normally distributed around the mean. This time, the data are piled up higher than normal around the mean or piled up higher than normal at the ends of the distribution.] Readers are referred to the following sources for a more detailed definition of kurtosis: http://www.statistics.com/index.php?page=glossary&term_id=326 and http://www.statsoft.com/textbook/basic-statistics/#Descriptive%20statisticsb |
| To standardize the kurtosis value so that its value can be constant across datasets and across studies, the following calculation must be made: Take the kurtosis value from the SPSS output and divide it by the Std. error of kurtosis. If the resulting calculation is within -3 to +3, then the kurtosis of the dataset is within the range of normality (Onwuegbuzie & Daniel, 2002). If the resulting calculation is outside of this +/-3 range, the dataset is not normally distributed. |
| * Continue |
| * OK |

Uncheck the "display frequency tables" so that you are not provided with the frequencies of your data every time descriptive statistics are obtained.
Check for Skewness and Kurtosis values falling within/without the parameters of normality (-3 to +3). Note that each variable below has its own skewness and its own kurtosis values. Thus, a total of three standardized skewness coefficients and three standardized kurtosis coefficients can be calculated from information in the table below.
| CH005TC09R | CL005TC09R | CW005TC09R | ||||||||||
| N |
| |||||||||||
| Skewness | -1.129 | -.479 | -2.197 | |||||||||
| Std. Error of Skewness | .044 | .058 | .056 | |||||||||
| Kurtosis | 1.818 | -.412 | 6.991 | |||||||||
| Std. Error of Kurtosis | .088 | .115 | .113 | |||||||||
| Standardized Coefficients Calculator |
| Copy variable #1 and #2 into the skewness and kurtosis calculator |

| √ Charts (these are calculated only if you wish to have visual depictions of skewness and of kurtosis-they are not required) |
| * Histogram~ with normal curve (not required, optional) |

| Calculate Paired Samples t-test on Data |
| √ Analyze |
| √ Compare Means |
| √ Paired samples t-test |

| √ Click on one dependent variable |
| √ Arrow to send over to Paired Variables Side, Variable 1 |

| √ Click on second dependent variable |
| √ Arrow to send over to Paired Variables Side, Variable 2 |

| √ OK |
| Check for Statistical Significance |
| Go to the Paired Samples Test Box and look at the very last cell labeled Sig. (2-tailed) to check for significance. |
| If you have any value less than .05 then you have statistical significance. Remember to replace the third zero with a 1 to a .000 value (i.e., for a value of .000, you would write it as .001). |
| Paired Samples Test | |||||||||||||||||||||||||
| Disability Group Membership |
| t | df | Sig. (2-tailed) | |||||||||||||||||||||
| Students with Learning Disabilities | Pair 1 | Verbal IQ (Wechsler Verbal Intelligence 3) - Performance 1 (Picture Completion) | 76.192 | 10.141 | .464 | 75.281 | 77.104 | 164.266 | 477 | .000 | |||||||||||||||
| 1. Numerical sentence is written as: |
| Numerical Sentence = t(df)sp=spt,sppsp<sp.001 (or Bonferroni-adjusted alpha). |
| - df is located in Paired Samples Box |
| - t is located in Paired Samples Box |
| 2. The outcome of the paired samples t-test, t(477) = 164.27 p < .001, was statistically significant. |
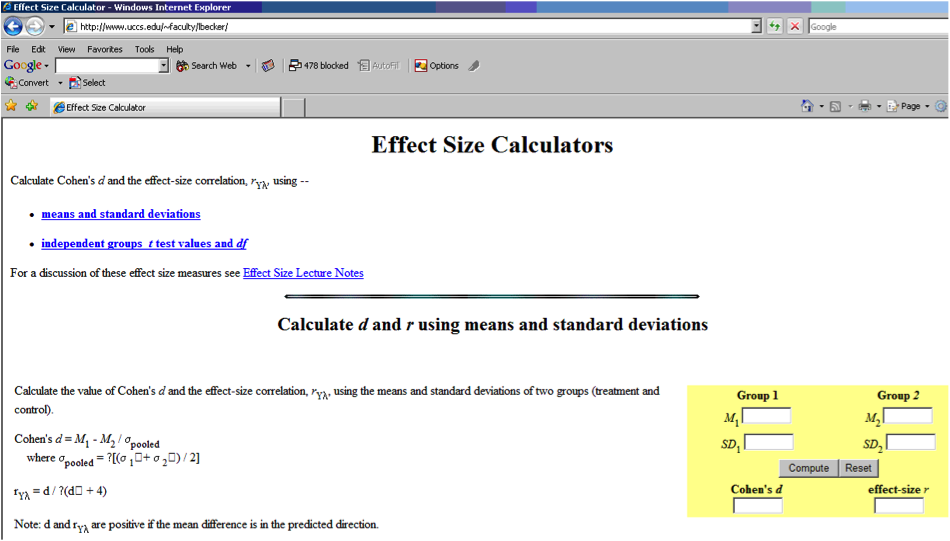
| Check for Effect Size |
| * Use the web-based calculator for effect size using the following websites: |
| Effect Size Calculators for Basic and Multivariate Statistical Procedures |
| Cohen’s d (1988) |
| d of 0.20 = small effect size (range 0.20 to 0.49) |
| d of 0.50 = moderate effect size (range 0.50 to 0.79) |
| d of 0.80 = large effect size (range 0.80 and above) |
| Note. Cohen’s d can be greater than 1.00. Therefore, a 0 should be placed in front of the decimal when the value is lower than 1.00. |
| Narrative and Interpretation |
| 1. type of t-test conducted and assumptions met |
| 2. t value |
| 3. degrees of freedom |
| 4. p value |
So, how do you "write up" your Research Questions and your Results? Schuler W. Huck (2000) in his seminal book entitled, Reading Statistics and Research, points to the importance of your audience understanding and making sense of your research in written form. Huck further states:
This book is designed to help people decipher what researchers are trying to communicate in the written or oral summaries of their investigations. Here, the goal is simply to distill meaning from the words, symbols, tables, and figures included in the research report. To be competent in this arena, one must not only be able to decipher what's presented but also to "fill in the holes"; this is the case because researchers typically assume that those receiving the research report are familiar with unmentioned details of the research process and statistical treatment of data.
Researchers and Professors John Slate and Ana Rojas-LeBouef understand this critical issue, so often neglected or not addressed by other authors and researchers. They point to the importance of doctoral students "writing up their statistics" in a way that others can understand your reporting and as importantly, interpret the meaning of your significant findings and implications for the preparation and practice of educational leadership. Slate and LeBouef provide you with a model for "writing up your parametric dependent sample t-test statistics."
Click here to view: Writing Up Your Parametric Dependent Samples t-test Statistics
| Cohen, J. (1988). Statistical power analysis for the behavioral sciences (2nd ed.). Hillsdale, NJ: Lawrence Erbaum |
| Hyperstats Online Statistics Textbook. (n.d.) Retrieved from http://davidmlane.com/hyperstat/ |
| Kurtosis. (n.d.). Definition. Retrieved from http://www.statistics.com/index.php?page=glossary&term_id=326 |
| Kurtosis. (n.d.). Definition of normality. Retrieved from http://www.statsoft.com/textbook/basic-statistics/#Descriptive%20statisticsb |
| Onwuegbuzie, A. J., & Daniel, L. G. (2002). Uses and misuses of the correlation coefficient. Research in the Schools, 9(1), 73-90. |
| Skewness. (n.d.) Retrieved from http://www.statistics.com/index.php?page=glossary&term_id=356 |
| Skewness. (n.d.). Definition of normality. Retrieved from http://www.statsoft.com/textbook/basic-statistics/#Descriptive%20statisticsb |
| StatSoft, Inc. (2011). Electronic statistics textbook. Tulsa, OK: StatSoft. WEB: http://www.statsoft.com/textbook/ |