Single Proportion
9.1 Hypothesis Testing: Single Mean and Single Proportion1
9.1.1 Student Learning Outcomes
By the end of this chapter, the student should be able to:
• Differentiate between Type I and Type II Errors
• Describe hypothesis testing in general and in practice
• Conduct and interpret hypothesis tests for a single population mean, population standard deviation
known.
• Conduct and interpret hypothesis tests for a single population mean, population standard deviation
unknown.
• Conduct and interpret hypothesis tests for a single population proportion.
9.1.2 Introduction
One job of a statistician is to make statistical inferences about populations based on samples taken from the
population. Confidence intervals are one way to estimate a population parameter. Another way to make
a statistical inference is to make a decision about a parameter. For instance, a car dealer advertises that
its new small truck gets 35 miles per gallon, on the average. A tutoring service claims that its method of
tutoring helps 90% of its students get an A or a B. A company says that women managers in their company
earn an average of $60,000 per year.
A statistician will make a decision about these claims. This process is called "hypothesis testing." A hy-
pothesis test involves collecting data from a sample and evaluating the data. Then, the statistician makes a
decision as to whether or not there is sufficient evidence based upon analyses of the data, to reject the null
hypothesis.
In this chapter, you will conduct hypothesis tests on single means and single proportions. You will also
learn about the errors associated with these tests.
Hypothesis testing consists of two contradictory hypotheses or statements, a decision based on the data,
and a conclusion. To perform a hypothesis test, a statistician will:
1This content is available online at <http://cnx.org/content/m16997/1.11/>.
367
CHAPTER 9. HYPOTHESIS TESTING: SINGLE MEAN AND SINGLE
368
PROPORTION
1. Set up two contradictory hypotheses.
2. Collect sample data (in homework problems, the data or summary statistics will be given to you).
3. Determine the correct distribution to perform the hypothesis test.
4. Analyze sample data by performing the calculations that ultimately will allow you to reject or fail to
reject the null hypothesis.
5. Make a decision and write a meaningful conclusion.
NOTE: To do the hypothesis test homework problems for this chapter and later chapters, make
copies of the appropriate special solution sheets. See the Table of Contents topic "Solution Sheets".
9.2 Null and Alternate Hypotheses2
The actual test begins by considering two hypotheses. They are called the null hypothesis and the alternate
hypothesis. These hypotheses contain opposing viewpoints.
Ho: The null hypothesis: It is a statement about the population that will be assumed to be true unless it
can be shown to be incorrect beyond a reasonable doubt.
Ha: The alternate hypothesis: It is a claim about the population that is contradictory to Ho and what we
conclude when we reject Ho.
Example 9.1
Ho: No more than 30% of the registered voters in Santa Clara County voted in the primary election.
Ha: More than 30% of the registered voters in Santa Clara County voted in the primary election.
Example 9.2
We want to test whether the mean grade point average in American colleges is different from 2.0
(out of 4.0).
Ho: µ = 2.0
Ha: µ = 2.0
Example 9.3
We want to test if college students take less than five years to graduate from college, on the aver-
age.
Ho: µ ≥ 5
Ha: µ < 5
Example 9.4
In an issue of U. S. News and World Report, an article on school standards stated that about half
of all students in France, Germany, and Israel take advanced placement exams and a third pass.
The same article stated that 6.6% of U. S. students take advanced placement exams and 4.4 % pass.
Test if the percentage of U. S. students who take advanced placement exams is more than 6.6%.
Ho: p= 0.066
Ha: p > 0.066
Since the null and alternate hypotheses are contradictory, you must examine evidence to decide if you have
enough evidence to reject the null hypothesis or not. The evidence is in the form of sample data.
After you have determined which hypothesis the sample supports, you make a decision. There are two
options for a decision. They are "reject Ho" if the sample information favors the alternate hypothesis or "do
not reject Ho" or "fail to reject Ho" if the sample information is insufficient to reject the null hypothesis.
2This content is available online at <http://cnx.org/content/m16998/1.14/>.
369
Mathematical Symbols Used in Ho and Ha:
Ho
Ha
equal (=)
not equal (=) or greater than (> ) or less than (<)
greater than or equal to (≥)
less than (<)
less than or equal to (≤)
more than (> )
Table 9.1
NOTE: Ho always has a symbol with an equal in it. Ha never has a symbol with an equal in it. The
choice of symbol depends on the wording of the hypothesis test. However, be aware that many
researchers (including one of the co-authors in research work) use = in the Null Hypothesis, even
with > or < as the symbol in the Alternate Hypothesis. This practice is acceptable because we
only make the decision to reject or not reject the Null Hypothesis.
9.2.1 Optional Collaborative Classroom Activity
Bring to class a newspaper, some news magazines, and some Internet articles . In groups, find articles from
which your group can write a null and alternate hypotheses. Discuss your hypotheses with the rest of the
class.
9.3 Outcomes and the Type I and Type II Errors3
When you perform a hypothesis test, there are four possible outcomes depending on the actual truth (or
falseness) of the null hypothesis Ho and the decision to reject or not. The outcomes are summarized in the
following table:
ACTION
Ho IS ACTUALLY
...
True
False
Do not reject Ho
Correct Outcome
Type II error
Reject Ho
Type I Error
Correct Outcome
Table 9.2
The four possible outcomes in the table are:
• The decision is to not reject Ho when, in fact, Ho is true (correct decision).
• The decision is to reject Ho when, in fact, Ho is true (incorrect decision known as a Type I error).
• The decision is to not reject Ho when, in fact, Ho is false (incorrect decision known as a Type II error).
• The decision is to reject Ho when, in fact, Ho is false (correct decision whose probability is called the
Power of the Test).
Each of the errors occurs with a particular probability. The Greek letters α and β represent the probabilities.
α = probability of a Type I error = P(Type I error) = probability of rejecting the null hypothesis when the
null hypothesis is true.
3This content is available online at <http://cnx.org/content/m17006/1.8/>.
CHAPTER 9. HYPOTHESIS TESTING: SINGLE MEAN AND SINGLE
370
PROPORTION
β = probability of a Type II error = P(Type II error) = probability of not rejecting the null hypothesis when
the null hypothesis is false.
α and β should be as small as possible because they are probabilities of errors. They are rarely 0.
The Power of the Test is 1 − β. Ideally, we want a high power that is as close to 1 as possible. Increasing the
sample size can increase the Power of the Test.
The following are examples of Type I and Type II errors.
Example 9.5
Suppose the null hypothesis, Ho, is: Frank’s rock climbing equipment is safe.
Type I error: Frank thinks that his rock climbing equipment may not be safe when, in fact, it really
is safe. Type II error: Frank thinks that his rock climbing equipment may be safe when, in fact, it
is not safe.
α = probability that Frank thinks his rock climbing equipment may not be safe when, in fact, it
really is safe. β = probability that Frank thinks his rock climbing equipment may be safe when, in
fact, it is not safe.
Notice that, in this case, the error with the greater consequence is the Type II error. (If Frank thinks
his rock climbing equipment is safe, he will go ahead and use it.)
Example 9.6
Suppose the null hypothesis, Ho, is: The victim of an automobile accident is alive when he arrives
at the emergency room of a hospital.
Type I error: The emergency crew thinks that the victim is dead when, in fact, the victim is alive.
Type II error: The emergency crew does not know if the victim is alive when, in fact, the victim is
dead.
α = probability that the emergency crew thinks the victim is dead when, in fact, he is really alive
= P(Type I error). β = probability that the emergency crew does not know if the victim is alive
when, in fact, the victim is dead = P(Type II error).
The error with the greater consequence is the Type I error. (If the emergency crew thinks the victim
is dead, they will not treat him.)
9.4 Distribution Needed for Hypothesis Testing4
Earlier in the course, we discussed sampling distributions. Particular distributions are associated with
hypothesis testing. Perform tests of a population mean using a normal distribution or a student’s-t dis-
tribution. (Remember, use a student’s-t distribution when the population standard deviation is unknown
and the distribution of the sample mean is approximately normal.) In this chapter we perform tests of a
population proportion using a normal distribution (usually n is large or the sample size is large).
If you are testing a single population mean, the distribution for the test is for means:
X ∼ N µ X, σ X
√
or
t
n
df
4This content is available online at <http://cnx.org/content/m17017/1.13/>.
371
The population parameter is µ. The estimated value (point estimate) for µ is x, the sample mean.
If you are testing a single population proportion, the distribution for the test is for proportions or percent-
ages:
P’ ∼ N
p,
p·q
n
The population parameter is p. The estimated value (point estimate) for p is p’. p’ = x where x is the
n
number of successes and n is the sample size.
9.5 Assumption5
When you perform a hypothesis test of a single population mean µ using a Student’s-t distribution (often
called a t-test), there are fundamental assumptions that need to be met in order for the test to work prop-
erly. Your data should be a simple random sample that comes from a population that is approximately
normally distributed. You use the sample standard deviation to approximate the population standard
deviation. (Note that if the sample size is sufficiently large, a t-test will work even if the population is not
approximately normally distributed).
When you perform a hypothesis test of a single population mean µ using a normal distribution (often
called a z-test), you take a simple random sample from the population. The population you are testing
is normally distributed or your sample size is sufficiently large. You know the value of the population
standard deviation.
When you perform a hypothesis test of a single population proportion p, you take a simple random
sample from the population. You must meet the conditions for a binomial distribution which are there are
a certain number n of independent trials, the outcomes of any trial are success or failure, and each trial has
the same probability of a success p. The shape of the binomial distribution needs to be similar to the shape
of the normal distribution. To ensure this, the quantities np and nq must both be greater than five (np > 5
and nq > 5). Then the binomial distribution of sample (estimated) proportion can be approximated by the
normal distribution with µ = p and σ =
p·q . Remember that q = 1 − p.
n
9.6 Rare Events6
Suppose you make an assumption about a property of the population (this assumption is the null hypoth-
esis). Then you gather sample data randomly. If the sample has properties that would be very unlikely
to occur if the assumption is true, then you would conclude that your assumption about the population is
probably incorrect. (Remember that your assumption is just an assumption - it is not a fact and it may or
may not be true. But your sample data are real and the data are showing you a fact that seems to contradict
your assumption.)
For example, Didi and Ali are at a birthday party of a very wealthy friend. They hurry to be first in line
to grab a prize from a tall basket that they cannot see inside because they will be blindfolded. There are
200 plastic bubbles in the basket and Didi and Ali have been told that there is only one with a $100 bill.
Didi is the first person to reach into the basket and pull out a bubble. Her bubble contains a $100 bill. The
probability of this happening is 1 = 0.005. Because this is so unlikely, Ali is hoping that what the two
200
of them were told is wrong and there are more $100 bills in the basket. A "rare event" has occurred (Didi
getting the $100 bill) so Ali doubts the assumption about only one $100 bill being in the basket.
5This content is available online at <http://cnx.org/content/m17002/1.16/>.
6This content is available online at <http://cnx.org/content/m16994/1.8/>.
CHAPTER 9. HYPOTHESIS TESTING: SINGLE MEAN AND SINGLE
372
PROPORTION
9.7 Using the Sample to Support One of the Hypotheses7
Use the sample data to calculate the actual probability of getting the test result, called the p-value. The
p-value is the probability that, if the null hypothesis is true, the results from another randomly selected
sample will be as extreme or more extreme as the results obtained from the given sample.
A large p-value calculated from the data indicates that we should fail to reject the null hypothesis. The
smaller the p-value, the more unlikely the outcome, and the stronger the evidence is against the null hy-
pothesis. We would reject the null hypothesis if the evidence is strongly against it.
Draw a graph that shows the p-value. The hypothesis test is easier to perform if you use a graph because
you see the problem more clearly.
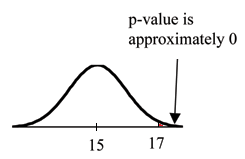
Example 9.7: (to illustrate the p-value)
Suppose a baker claims that his bread height is more than 15 cm, on the average. Several of his
customers do not believe him. To persuade his customers that he is right, the baker decides to do a
hypothesis test. He bakes 10 loaves of bread. The mean height of the sample loaves is 17 cm. The
baker knows from baking hundreds of loaves of bread that the standard deviation for the height
is 0.5 cm. and the distribution of heights is normal.
The null hypothesis could be Ho: µ ≤ 15 The alternate hypothesis is Ha: µ > 15
The words "is more than" translates as a "> " so " µ > 15" goes into the alternate hypothesis. The null hypothesis must contradict the alternate hypothesis.
Since σ is known ( σ = 0.5 cm.), the distribution for the population is known to be normal with
mean µ= 15 and standard deviation σ
√
= 0.5
√
= 0.16.
n
10
Suppose the null hypothesis is true (the mean height of the loaves is no more than 15 cm). Then
is the mean height (17 cm) calculated from the sample unexpectedly large? The hypothesis test
works by asking the question how unlikely the sample mean would be if the null hypothesis
were true. The graph shows how far out the sample mean is on the normal curve. The p-value is
the probability that, if we were to take other samples, any other sample mean would fall at least
as far out as 17 cm.
The p-value, then, is the probability that a sample mean is the same or greater than 17 cm.
when the population mean is, in fact, 15 cm. We can calculate this probability using the normal
distribution for means from Chapter 7.
p-value = P (x > 17) which is approximately 0.
7This content is available online at <http://cnx.org/content/m16995/1.17/>.
373
A p-value of approximately 0 tells us that it is highly unlikely that a loaf of bread rises no more
than 15 cm, on the average. That is, almost 0% of all loaves of bread would be at least as high
as 17 cm. purely by CHANCE had the population mean height really been 15 cm. Because the
outcome of 17 cm. is so unlikely (meaning it is happening NOT by chance alone), we conclude
that the evidence is strongly against the null hypothesis (the mean height is at most 15 cm.). There
is sufficient evidence that the true mean height for the population of the baker’s loaves of bread is
greater than 15 cm.
9.8 Decision and Conclusion8
A systematic way to make a decision of whether to reject or not reject the null hypothesis is to compare the
p-value and a preset or preconceived α (also called a "significance level"). A preset α is the probability of a Type I error (rejecting the null hypothesis when the null hypothesis is true). It may or may not be given
to you at the beginning of the problem.
When you make a decision to reject or not reject Ho, do as follows:
• If α > p-value, reject Ho. The results of the sample data are significant. There is sufficient evidence to
conclude that Ho is an incorrect belief and that the alternative hypothesis, Ha, may be correct.
• If α ≤ p-value, do not reject Ho. The results of the sample data are not significant. There is not
sufficient evidence to conclude that the alternative hypothesis, Ha, may be correct.
• When you "do not reject Ho", it does not mean that you should believe that Ho is true. It simply
means that the sample data have failed to provide sufficient evidence to cast serious doubt about the
truthfulness of Ho.
Conclusion: After you make your decision, write a thoughtful conclusion about the hypotheses in terms
of the given problem.
9.9 Additional Information9
• In a hypothesis test problem, you may see words such as "the level of significance is 1%." The "1%" is
the preconceived or preset α.
• The statistician setting up the hypothesis test selects the value of α to use before collecting the sample
data.
• If no level of significance is given, the accepted standard is to use α = 0.05.
• When you calculate the p-value and draw the picture, the p-value is the area in the left tail, the right
tail, or split evenly between the two tails. For this reason, we call the hypothesis test left, right, or two
tailed.
• The alternate hypothesis, Ha, tells you if the test is left, right, or two-tailed. It is the key to conducting
the appropriate test.
• Ha never has a symbol that contains an equal sign.
•
Thinking about the meaning of the p-value: A data analyst (and anyone else) should have more
confidence that he made the correct decision to reject the null hypothesis with a smaller p-value (for
example, 0.001 as opposed to 0.04) even if using the 0.05 level for alpha. Similarly, for a large p-value
like 0.4, as opposed to a p-value of 0.056 (alpha = 0.05 is less than either number), a data analyst should
have more confidence that she made the correct decision in failing to reject the null hypothesis. This
makes the data analyst use judgment rather than mindlessly applying rules.
8This content is available online at <http://cnx.org/content/m16992/1.11/>.
9This content is available online at <http://cnx.org/content/m16999/1.13/>.
CHAPTER 9. HYPOTHESIS TESTING: SINGLE MEAN AND SINGLE
374
PROPORTION
The following examples illustrate a left, right, and two-tailed test.
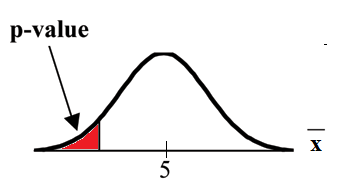
Example 9.8
Ho: µ = 5
Ha: µ < 5
Test of a single population mean. Ha tells you the test is left-tailed. The picture of the p-value is as
follows:
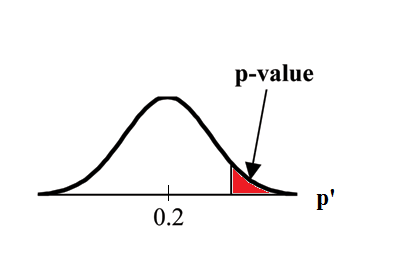
Example 9.9
Ho: p ≤ 0.2
Ha: p > 0.2
This is a test of a single population proportion. Ha tells you the test is right-tailed. The picture of
the p-value is as follows:
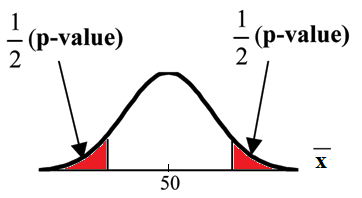
Example 9.10
Ho: µ = 50
Ha: µ = 50
This is a test of a single population mean. Ha tells you the test is two-tailed. The picture of the
p-value is as follows.
375
9.10 Summary of the Hypothesis Test10
The hypothesis test itself has an established process. This can be summarized as follows:
1. Determine Ho and Ha. Remember, they are contradictory.
2. Determine the random variable.
3. Determine the distribution for the test.
4. Draw a graph, calculate the test statistic, and use the test statistic to calculate the p-value. (A z-score
and a t-score are examples of test statistics.)
5. Compare the preconceived α with the p-value, make a decision (reject or do not reject Ho), and write
a clear conclusion using English sentences.
Notice that in performing the hypothesis test, you use α and not