Concentration of
Total amount of
(in ounces)
alcohol expressed
alcohol expressed
alchol
as a percent
as a percent in
(in ounces)
decimal form
Beer
12
5
0.05
0.6
Wine 5 12 0.12
0.6
Hard liquor
1.5
40
0.40
0.6
Answers to questions on Master 2.1, What Is a Drink? , follow: Students should recognize that typical servings of beer, wine, and hard liquor contain about the same amounts of alcohol. It is not the type of drink but rather the amount of alcohol consumed that determines the extent to which an individual is affected by drinking.
76

Question 1. Which contains more alcohol, a 12-ounce bottle of beer
that is 5 percent alcohol or 1 ounce of whiskey that is 50 percent alco-
hol? Show your calculations.
The serving of beer contains more alcohol than does the serving of whiskey.
Beer: 12 ounces x 0.05 (that is, 5% alcohol) = 0.6 ounces alcohol Whiskey: 1 ounce x 0.50 (that is, 50% alcohol) = 0.5 ounces alcohol
Question 2. Based on your calculations, is it safer for a person to
drink beer than it is to drink whiskey?
The higher alcohol content of the beer in Question 1 demonstrates that it is not safer to drink beer than it is to drink hard liquor.
Rather, the alcohol content and volume consumed determine the
effects of the alcoholic beverage on an individual.
Working through this question enables students to respond correctly to Statement 4 on Master 1.1, Alcohol: Is This Right? : “Drinking beer is safer than drinking wine or hard liquor such as vodka or whiskey.”
Teacher note
Assessment:
Students may raise questions about a “shot,” or 1.5 ounces, being the typi-To evaluate the stu-
cal serving size for hard liquor. Students are likely to have seen mixed drinks containing hard liquor that are much larger than 1.5 ounces.
dents’ understanding
Remind students that these drinks often have other liquids, such as water, of concentration,
juice, or soft drinks, mixed in with the alcohol. You may remind students assign a few problems
that a 12-ounce beer contains the same number of ounces of alcohol to solve, such as, How
(0.6 ounces; see the table above), and the rest is primarily water.
many 12-ounce beers
containing 5 percent
Teacher note
In the classroom, you may encounter questions about how the percentage alcohol does it take to
of alcohol in a drink relates to the concept of proof. In the United States, equal the amount of
proof is a measure equivalent to twice the percentage of alcohol by volume; alcohol contained in a
that is, an 80-proof liquor is 40 percent alcohol by volume.
30-ounce bottle of
wine that contains
18. Ask students to summarize what they have learned from the activ-12 percent alcohol?
ity by asking them to identify the factors that determine the (Answer: Six bottles of
amount of alcohol contained in an alcoholic beverage.
beer.)
Students should respond that the percentage of alcohol in the drink and the serving size determine the amount of alcohol contained in an alcoholic beverage.
77
Student Lesson 2
Understanding Alcohol: Investigations into Biology and Behavior Activity 2: Where Does Alcohol Go in the Body?
1. Introduce this part of the lesson by asking, “What happens to the alcohol after a person takes a drink? Where does it go?” As students name parts of the body, ask them to put their responses in the proper sequence, tracing the path that alcohol takes as it passes through the body.
You may want to prompt students by saying that alcohol enters
through the mouth. Then ask, “Where does alcohol go next?”
2. To help students visualize how alcohol is distributed throughout the body, display the transparency of Master 2.2, Tracing Alcohol’s
Path through the Body.
Alcohol is normally taken into the body through the mouth. After it is swallowed, it passes down the throat (esophagus). Help the students appreciate that when alcohol is consumed, it is first absorbed by the stomach and small intestine, then incorporated into the bloodstream. Students may continue by saying that alcohol goes to the liver, where it is metabolized (or broken down). After alcohol is metabolized, it passes through the kidneys, which process it for excretion in the urine. Be sure that students trace the path as depicted in Figure 2.4 below.
1. Alcohol enters the mouth.
2. Alcohol travels down the throat to the stomach.
3. Alcohol is absorbed into the blood by the stomach
and small intestine.
4. Alcohol travels through the blood to the water-con-
taining organs of the body.
5. Alcohol affects many brain functions.
6. Alcohol is metabolized in the liver.
7. Alcohol is excreted from the body after processing
by the kidneys.
Figure 2.4. Tracing alcohol’s path through the body.
78


3. Now that students have traced the path of alcohol as it moves through the body, ask them to consider whether the alcohol distributes evenly through the body or whether it stays in only certain types of body tissues. Explain to the class that you will conduct a demonstration to investigate this question.
4. Place the two containers with different ratios of oil and water in Content Standard A:
full view of the class. As with the previous demonstration, explain Think critically and logi-that each container represents a human body. Inform students that cally to make the rela-each container has oil and water in it. Ask what differences they tionships between
observe in the two containers. Which layer is the oil? Which layer evidence and explana-is the water?
tions.
Students should note that the liquids form two layers and that the layers differ in size. The total volume of liquid (oil + water) is the Content Standard B:
same in each container. The oil is the top layer, and the water is the A substance has char-bottom layer.
acteristic properties,
such as density, a boil-
Tip from the field test: Students can relate the two containers to people with different body types—one a lean athlete with a lower amount of body ing point, and solubil-fat and the other a couch potato with a higher amount of body fat. How-ity, all of which are
ever, be sure to reinforce the idea that you are comparing two people of the independent of the
same weight.
amount of the sample.
5. Ask the class why the water and oil form two separate layers.
Explain that water is immiscible, or does not mix, with oil. If a liquid mixes with another liquid, it is miscible with the other liquid.
Other examples of immiscible liquids that students may think of include oil spills in the ocean where the oil floats on the surface and Assessment:
oil-and-vinegar salad dressings that separate into layers when the To reinforce the
bottle is not shaken. An example of miscible liquids that students concept of miscibility,
would be familiar with would be lemon juice and water (lemonade).
provide the students
with a short list of
everyday liquids and
ask them which
liquids will mix with
which other liquids.
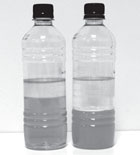
Figure 2.5. Bottles containing oil and
water can simulate people with different
body types.
79
Student Lesson 2
Understanding Alcohol: Investigations into Biology and Behavior 6. Ask the class to predict what will happen if you pour alcohol into the containers. List the predictions on the board.
Again, responses will vary. Some will respond that alcohol will mix evenly throughout the solutions, while others will predict that alcohol will mix with either the oil or the water.
7. Quickly pour 1 ounce of the red-colored alcohol solution into one of the containers. Use a stirring rod to gently mix the solution. Ask students what happened to the alcohol.
The alcohol mixes with the lower water layer. Bubbles will appear in the oil layer as the alcohol passes through it. Some red color might be seen in the bubbles, but it should be obvious that the alcohol is preferentially mixing with the water layer.
8. Pour the second 1 ounce of red-colored alcohol solution into the second container. Gently mix with the stirring rod. Again, ask students what happened to the alcohol.
As with the first container, students should notice that the alcohol mixes with the water but not the oil.
9. Ask the class to compare the two containers. Are there differences that they can see? Is alcohol miscible with oil or water?
Students should note that the red color is more concentrated in the glass containing the smaller amount of water (4 ounces) and more mineral oil than in the glass containing more water (6 ounces) and less mineral oil. As before, the total amount of liquid in each container is equal. Alcohol is miscible with water and not with oil.
10. Ask the class to relate their observations to people who drink alcoholic beverages.
• Can you tell how alcohol will affect a person by his or her appearance alone?
It is not possible to tell just by appearance how people will be affected by alcohol. As you recall from the demonstrations, alcohol mixes with water and not with oil; this is true in the body as well.
Two people of the same size may have different amounts of body fat.
The leaner person’s body contains more water than the body of the person with the higher body-fat level. Therefore, the concentration of alcohol (in the water-containing portions of the body) would be higher in the person with more body fat (same amount of alcohol in 80
a lower total volume). This means that the higher-body-fat person would be more affected by a given dose of alcohol than a lean person of the same size. Because females, on average, have more body fat than males, they tend to feel the effects of alcohol more readily than do men. In summary, because body-fat content cannot be determined by appearance alone, it is not possible to predict the effects of alcohol on an individual solely by visual examination.
• If two individuals have the same amount of body fat but one individual is larger than the other, who would be more affected by drinking a beer?
A number of factors, including body size, account for human variation in response to alcohol. A larger body size means a greater blood volume for alcohol distribution as compared with a smaller body size with an equal body fat content. Thus, in general, a larger person will be less influenced by a given alcohol dose than a smaller person will.
• Because the brain is sensitive to the effects of alcohol, what can you conclude about the composition of the brain?
Since the brain is affected by alcohol, it must contain a significant amount of water into which the alcohol can mix.
Teacher note
These questions may bring up some sensitive issues for students. The effects of alcohol on the body are more complex than body size and amount of body fat. Although females are usually smaller than males and have higher levels of body fat, a comparison strictly on the basis of gender is not accurate. Other factors also influence how alcohol affects a person.
For example, females, in general, are more sensitive to the effects of alcohol than males are because of differences in distribution.
81
Student Lesson 2
Understanding Alcohol: Investigations into Biology and Behavior Lesson 2 Organizer
Activity 1: What Is a Drink?
What the Teacher Does
Procedure Reference
Ask the class to name different kinds of alcoholic beverages
Pages 72–73
and list them on the board.
Step 1
Have the class categorize each beverage as beer, wine, or
Page 73
hard liquor.
Step 2
Invite students to consider differences between the different
Page 73
types of drinks.
Step 3
Show the class three simulated alcoholic beverages and ask
Pages 73–74
the students to share their observations about them.
Steps 4 and 5
Show the class three containers of water that each represent
Page 74
a human body.
Step 6
• Ask the class to predict what will happen when the
simulated drinks are poured into the containers.
Pour each of the simulated drinks into a separate container
Page 74
and ask the class,
Steps 7–10
• Do they look the same or different from each other?
• Which container has the most “alcohol” in it?
Introduce the concept of concentration and ask the class,
Pages 74–76
• Which container has the highest concentration of
Steps 11–14
alcohol?
= Involves copying a master.
= Involves using a transparency.
82
• How do the amounts of alcohol added to each con-
Pages 74–76
tainer compare?
Steps 11–14
• Which simulated drink has the highest (and lowest)
(continued)
alcohol concentration?
Have the class consider how the same amount of alcohol
Page 76
affects a smaller person compared with a larger person.
Step 15
• Would the concentration of alcohol in the blood be the
same for each person?
• Which person would have the higher concentration of
alcohol in their blood?
• Why does the same amount of alcohol have a greater
effect on the smaller person?
Have the students calculate the amount of alcohol in each
Pages 76–77
type of drink using Master 2.1, What Is a Drink? Ask them to Steps 16
draw conclusions about how different drinks compare with
and 17
each other.
Ask the class to identify factors that determine the amount
Page 77
of alcohol in an alcoholic beverage.
Step 18
Activity 2: Where Does Alcohol Go in the Body?
What the Teacher Does
Procedure Reference
Discuss where alcohol goes once it enters the body.
Pages 78–79
• Help students visualize the pathway of alcohol through
Steps 1–3
the body using Master 2.2, Tracing Alcohol’s Path
through the Body.
• Ask students if alcohol distributes evenly throughout
the different body tissues.
83
Student Lesson 2
Understanding Alcohol: Investigations into Biology and Behavior Show the class two containers with mixtures of oil and
Page 79
water.
Steps 4 and 5
• Explain that each container represents a human body.
• Discuss the concept of miscible liquids.
Ask the class to predict what will happen when a simulated
Page 80
alcoholic drink is poured into each container.
Step 6
Pour the simulated drinks into each container. Ask the class,
Page 80
• Are there differences between the two containers?
Steps 7–9
• Is alcohol miscible with oil or water?
Have the class relate their observations to people drinking
Pages 80–81
alcohol.
Step 10
• Can appearance alone tell you how alcohol will affect a
person?
• Why do people show variation in response to the same
amount of alcohol?
• Since the brain is sensitive to the effects of alcohol,
what can you conclude about its composition?
84
What Is a Drink?
Name ________________________
Date _____________________
Calculate the total amount of alcohol in a typical serving of the following alcoholic drinks.
Type of drink