TEASER - 12
DEGREE OF DISTANCE
A contour map, by definition, is a map of a surface showing undulations with the help of lines joining equal elevation, also called topographic map.
On a regional scale, the ratio of a unit distance on a contour map at any point to that on ground is always same.
(a) True
(b) Falls
THE EXPLANATION:
A map or any drawing made on a flat sheet of paper are 2D transformation of 3D objects. Even the image formed on our retina (eye) is in 2D format. The 3D perception in our brain is caused due to 2D image received from two different eyes set at an angle with respect to center of an object.
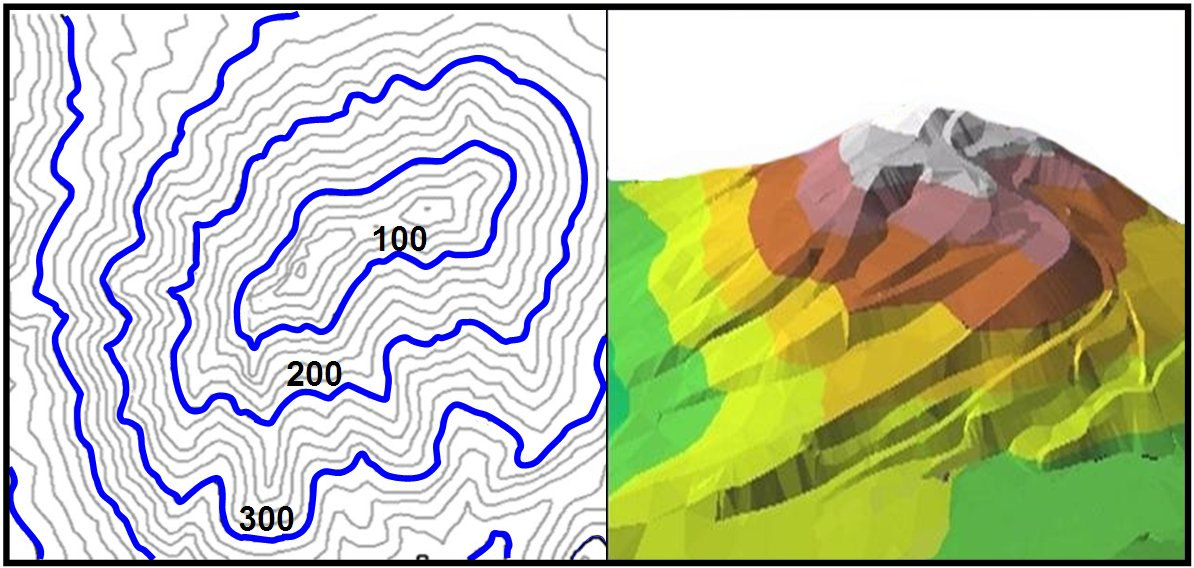
During earlier days relief on a map used to be shown with the help of variations of light and shade to give effect of 3D objects in 2D images. As the use of shading became systematized the contour lines, visually representing different elevations of land came into general use. Contour map is a graphical conventional method for showing changes in height or depth on a 2D map with the help of lines that connect points of equal elevation called contour lines.
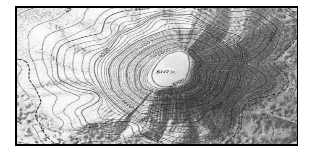
CONTOUR MAP WITH VARIABLE SHADING
The pattern of contour lines can depict landforms. Areas of tightly spaced contour lines describe steep changes in elevation and sparse contours depict flat areas. The Mean Sea Level (MSL) is generally taken as “base” or datum surface, on which contours are referenced or plotted. With each contour line representing a standard distance above or below the base line, one can accurately calculate height or depth simply by counting the lines from the base line.
Theoretically, the distance measured on a contour map, in accordance with its scale should match to that on ground. However earth, being a spheroid, making a regional contour map is a tricky one.
Two things can happen while making contour maps (especially on a regional scale) of earth surface;
i. The globe surface is curved along two directions X & Y axis. When flattened or stretched it cracks vertically (when one axis is curved) and also horizontally when both axis are curved.
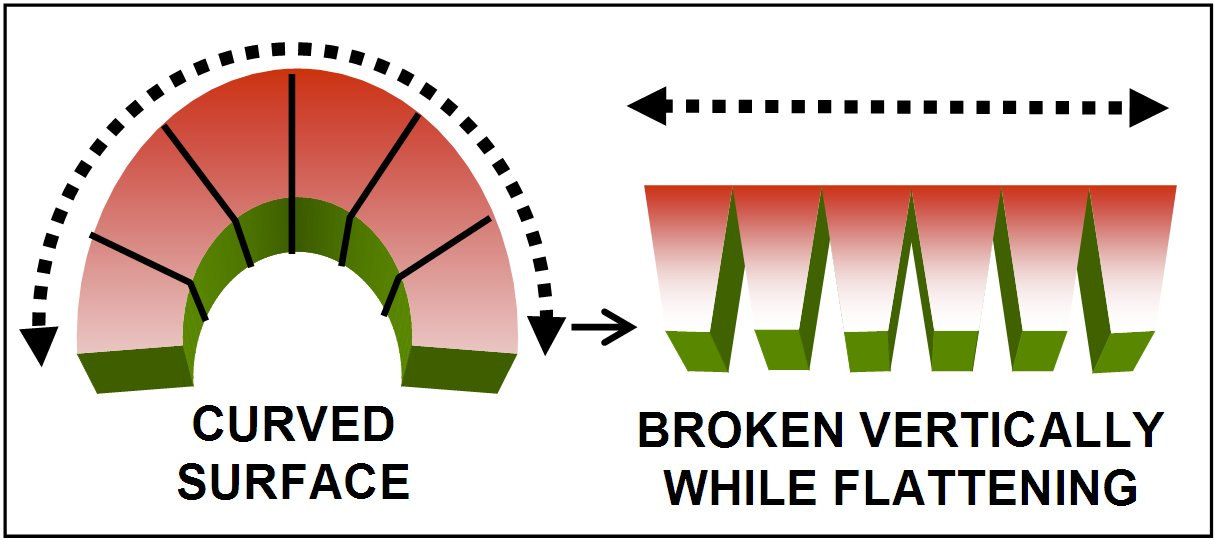
RIGID CAKE CURVED AND FLATTENED
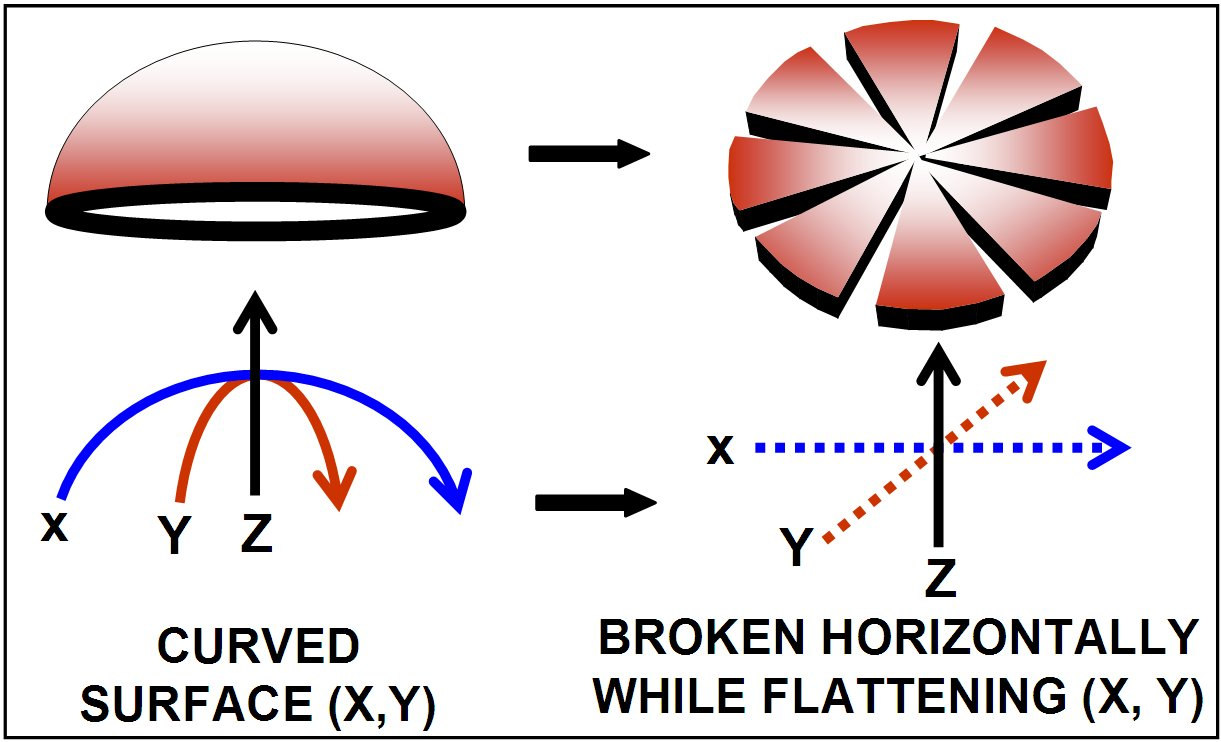
RIGID HEMI-SPHEROID (EARTH) CURVED AND FLATTENED
ii. The tall mountain (vertical component: height or depth) is squashed onto a 2D flat base or datum surface.
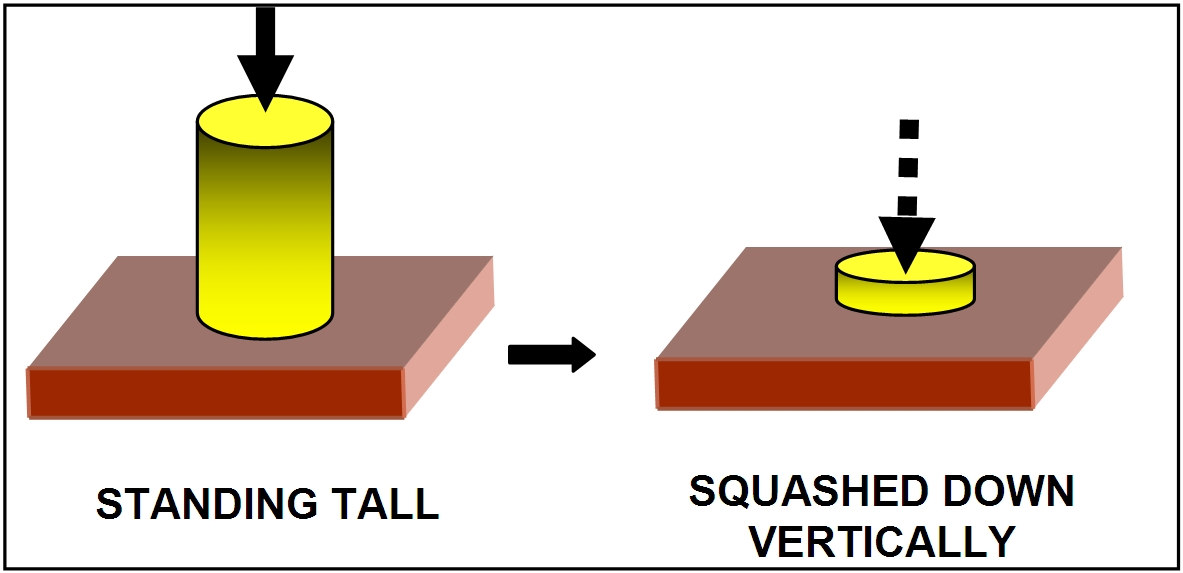
TALL OBJECT SQUASHED ON A FLAT SURFACE
While making contour maps, the plumb lines (or longitude lines) that converge downward towards center of earth are made parallel with constant distance between longitudes, irrespective of undulations.
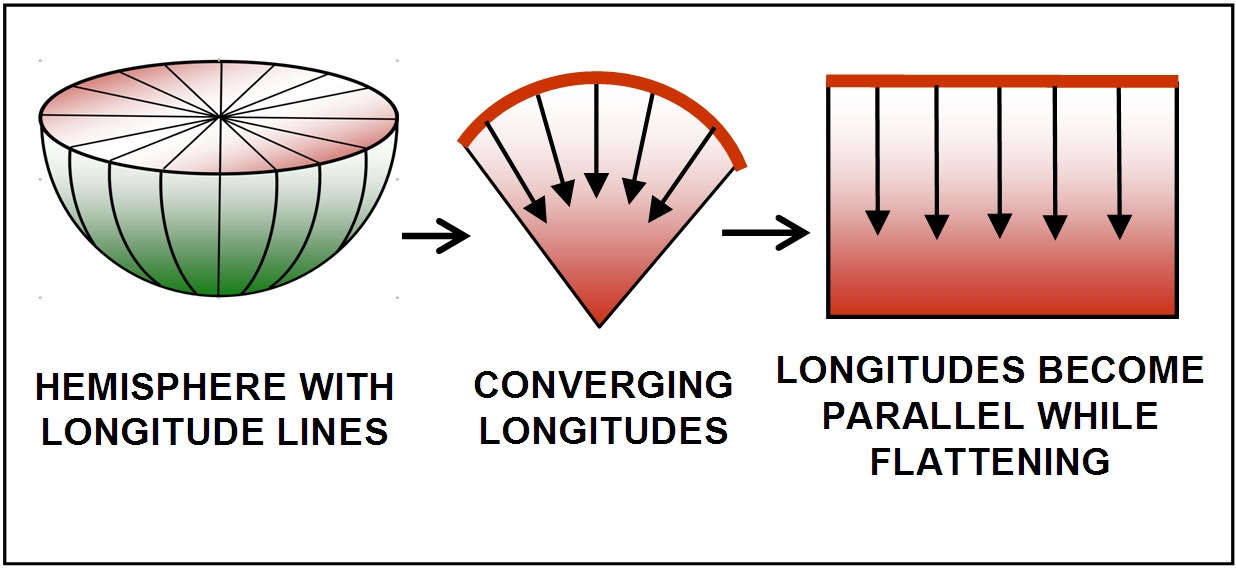
LONGITUDE LINES BECOME PARALLEL ON FLATTENING
The earth surface can be likened to a curved rubber sheet over which cones (similar to mountains) are placed. When rubber sheet is flattened the distance between summits (S1 – S2 – S3) of cones progressively decreases where as distance between base (root) of cones (R1 – R2 – R3) does not change.
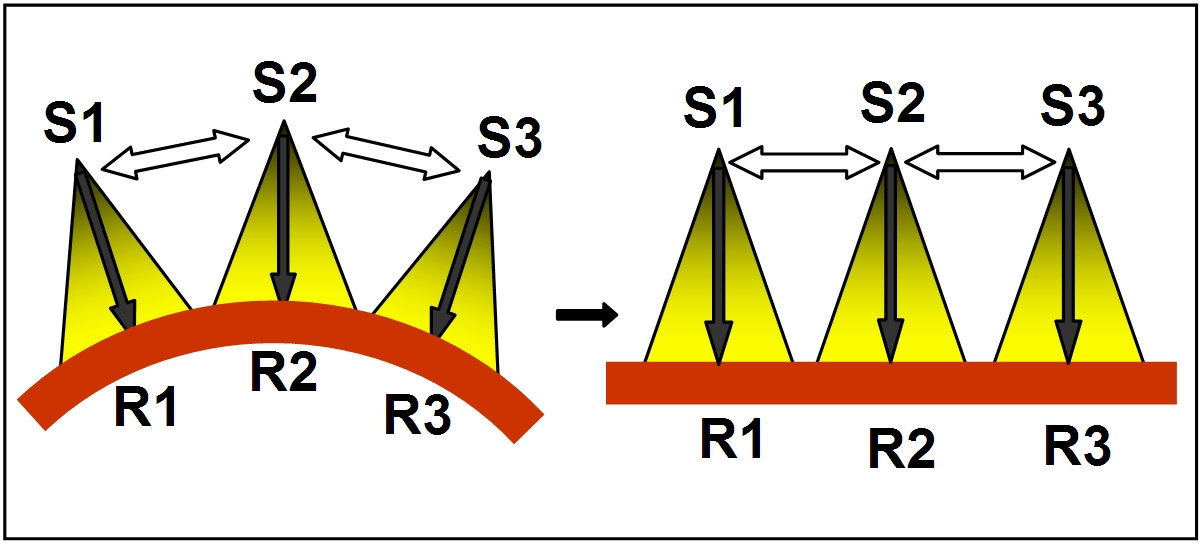
RUBBER SHEET WITH CONES (CURVED & FLATTENED)
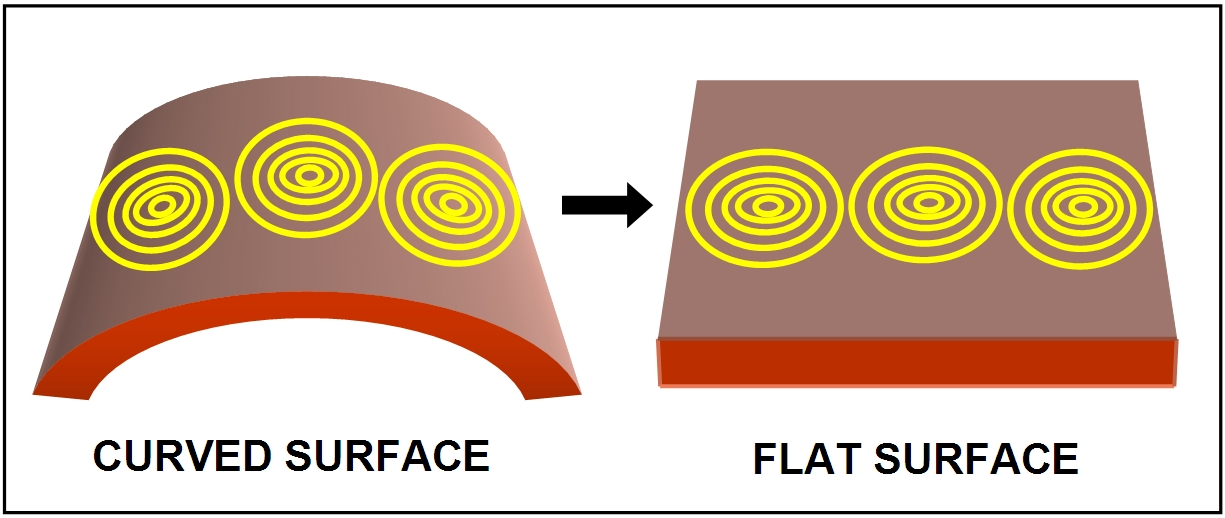
CONTOURES OF CONES PLOTTED ON RUBBER SHEET
Where as the distance between summits of cone (S1, S2, S3) in a contour map, does not change, irrespective of bending or flattening of rubber sheet. The contour map assumes that the distances between S1 to S2 to S3 is same as that between R1 to R2 to R3.
In a regional contour map, the bigger area of a mountain, such as Himalaya or Tibetan Plateau, are squeezed on to a smaller area on a datum plane, such as Mean Sea Level (MSL). Conversely, the depths of oceans are brought-up and stretched. Therefore one (single) scale may not be applicable to measure a ratio between a unit distance on map to that on the ground at all points in a regional map.
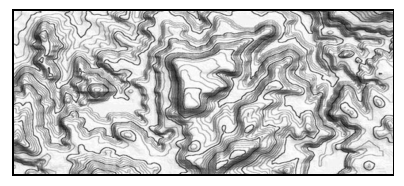
CONTOUR MAP OF AN UNDULATING SURFACE (2D)
Although a single scale has been provided for above contour map, the ratio (map to ground) may be different for depths (dark region) and different for high ground (light region).
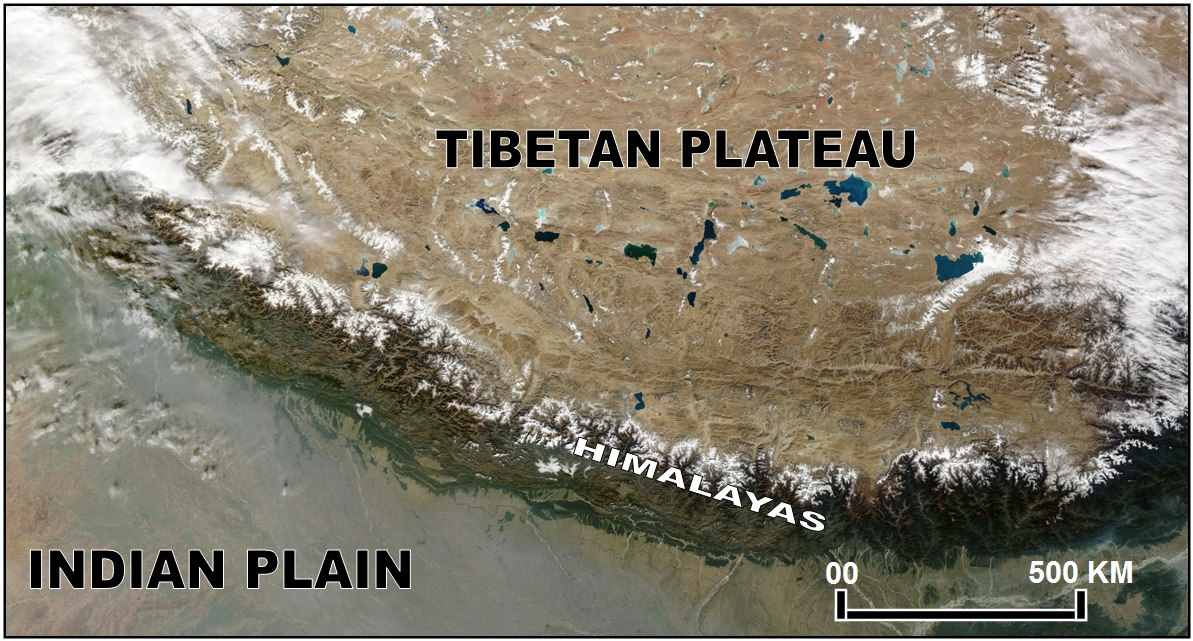
RELIEF MAP OF TIBETAN PLATEAU AND INDIAN PLAIN (ONE SCALE MAY NOT BE APPLICABLE)
Similarly a single scale may not be applicable for a map or a photograph of large area depicting Himalayas, Tibetan plateau and Indian Planes together. There may be huge elevation difference between them.
********