Indebtedness expanded explosively prior to 2008, and made a severe crash inevitable. The underlying cause was massive risk-taking on the part of the finance sector, but it was helped by complacency on the part of governments and regulators. This complacency seems quite extraordinary, given the exponential rise in household debt in the years preceding the 2008 crash - see figure 54.5. It was helped by the theories and economic models used by central banks, the treasury and other policy-making agencies - the so-called Dynamic Stochastic General Equilibrium (DSGE) models. The name sounds impressive but the underlying assumptions are less so. Those theories and models assume that as long as inflation stays low then financial and macroeconomic stability follow. They therefore ignore much of the financial system - banks are almost entirely missing and there are no mortgage lenders or financial traders (Turner 2016 p170 and Desai 2015 p197), so it is no wonder that household debt can't ever be a problem. That policy-making bodies can apply methods that are so far out of touch with reality is quite staggering. Not only that, they are still being applied even after the crash. As Turner observed:
You cannot see a crisis coming if you have theories and models that assume that the crisis is impossible. (Turner 2016 p246)
DSGE models are considered further in chapter 80.
Debts exploded when banks persuaded regulators to relax the rules on securitisation - the selling of derivatives based on debts, especially mortgages, to investors. These were touched on earlier in chapter 50. This was the key element that removed the need for caution in the selection of debtors by creditors. Increasing creditor profit depends on increasing debts, which depends in turn on finding a steady supply of new debtors to take on the debts. With traditional caution this requires high quality debtors, the supply of which dries up fairly soon, as does the growth in creditor profits. But without caution the supply is almost endless, and culminated in the ludicrous situation where money was lent to debtors with no creditworthiness at all - no income, no job, and no assets - the 'NINJA' borrowers. These were the 'liar loans'[193], given to people against properties that they couldn't hope to pay for but would cover the investors' and banks' loan and associated interest and fees when repossessed. How anyone, especially regulators, could have seriously thought that this was an economically harmless activity is amazing. It was all based on the belief that property prices would keep on rising. Why should we care if a borrower can't make the payments? We just repossess their property and sell it to pay off the debt, with a few nice fat fees for our trouble. What about the people who are made homeless? Who cares about them? We're making money and that's all that matters.
To see how these debts worked we need to examine the three main parties involved: the investors who wanted to own them (the creditors); those who made them available to investors (the finance sector); and the borrowers who funded everything (the debtors).
These were mainly the growing number of people, institutions, businesses and governments with sufficient excess of money over and above their requirements to wish to invest it, preferably for a high and secure return. As the chart below shows, from 1980 onwards, when the Thatcher and Reagan Governments began the process of removing power from unions and the workforce in favour of employers and cut the rate of tax for high earners, wealth inequality began to climb. Figure 54.1 shows the growth in US income for the most highly paid from that time onwards related to the decline in trades union membership. The UK situation was similar.
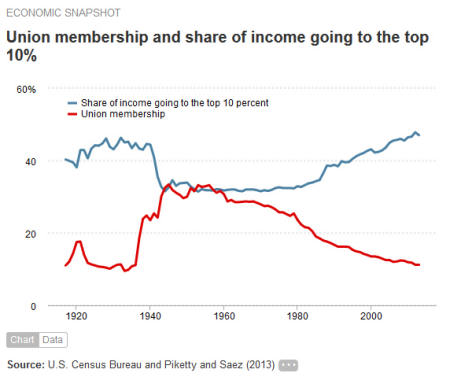
Figure 54.1: Relationship between the decline in workforce power and wealth for the top 10%. Source data from The US Census Bureau, Thomas Piketty and Emmanuel Saez[194], recovered from http://www.epi.org/publication/unions-decline-and-the-rise-of-the-top-10-percents-share-of-income/
Much of the increased income for high earners and for their businesses became available for investment, and as a result the demand for financial assets began to increase with corresponding price increases. The effect of a price increase for an asset that delivers a fairly constant return in terms of income (as do bonds and equities) is to make the ratio of price to income higher. This is reflected in lower interest payments for debts, and in a higher price/earnings ratio for equities. The effect is seen in figure 54.2.
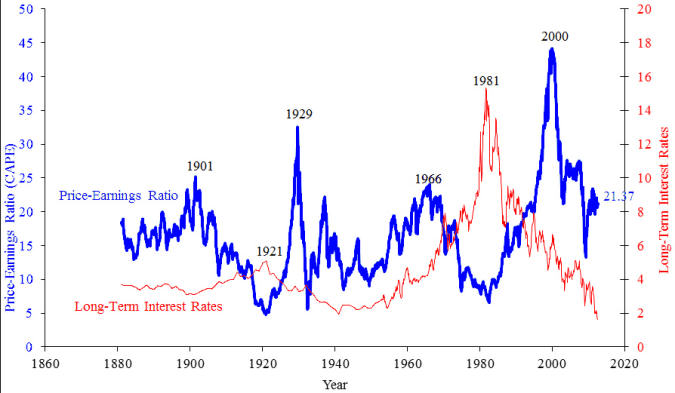
Figure 54.2: Long-term interest rate and price/earnings ratio. Modelled on a plot from the book 'Irrational Exuberance' by Robert Schiller, 2005, with data taken from http://www.econ.yale.edu/~shiller/data/ie_data.xls. Recovered from https://en.wikipedia.org/wiki/Price%E2%80%93earnings_ratio
It shows that the long-term interest rate was in steep decline from 1981 onwards, so the returns on traditional debt assets such as government and corporate bonds grew correspondingly lower. Returns on equities were also in sharp decline, at least until 2000 when the dotcom bubble burst, the chart showing the price to earnings ratio increasing rapidly in this period. After the dotcom crash equity returns improved as their prices dropped, but the appetite for them remained constrained because so many had lost money in that crash. Therefore those with money to invest had an increasing amount of it, and that provided a strong demand for investments, the more secure the better, and bond prices rose correspondingly.
From the mid-1980s, when the finance sector expanded massively in the wake of 'big bang' deregulation[195], the opportunities for banking and financial innovation increased dramatically and the bankers and financiers were not slow in taking advantage of them. Remember that banks' profits depend on the amount of money they create, so the more they create the better it is for them. But there is a problem - banks are constrained by the need to keep risks to an acceptable level. Remember from the last chapter that there are plenty of potential borrowers, and the less able they are to repay the more there are, so a bank finds itself in severe competition with other banks for high quality borrowers that all banks want to attract, but must turn away low quality borrowers that no bank wants to attract. If only there was a way to get rid of the risky loan agreements it could take on more of the risky borrowers.
Bright idea no 1! Sell the loan agreements to others. The advantage for the banks is that they sell the risk along with the loan agreement and no longer need worry about creditworthiness, but the disadvantage is that the investor gets the interest payments instead of the bank. That won't matter though provided that the bank gets a nice fat fee, and uses the money (or more accurately the reserves that accompany it) from the investor to fund another loan agreement, and keeps on doing that indefinitely. That way the gains will massively outweigh the losses - perfect! But investors aren't daft, they know that the loans are risky, so no-one would buy a loan as it stands except at a very deep discount. Besides that banks don't want to have to find buyers for every separate loan that they have on their books, they want a rapid and continuous transfer of loans to investors.
Bright idea no. 2! Package up the loans so as to average out all the individual default risks, then slice them up and sell the slices. That still sounds a bit dodgy so let's call it 'securitisation' - that sounds much more respectable.[196] But why would anyone buy a slice? Investors would know that some proportion would go bad so the quality of the investment would be hard to determine and they would most likely play safe and not touch it.
Bright idea no. 3! The bank itself could specify the risk by first carving up the mass into a small number of big slices, and arranging them in a tiered hierarchy such that any defaulting loans would affect the lowest tier first, then if there were even more defaulting loans the next tier would be affected, and so on, each tier carrying a different interest rate - highest at the bottom because that tier carried the highest risk and lowest at the top because that tier carried the lowest risk. These tiers were called tranches, each appealing to a different type of investor related to risk appetite. For example cautious pension funds would only buy from the topmost tranches whereas hedge funds would buy from all tranches. The rating agencies would be called in to rate each separate tranche to give confidence to the investors, and nice fat fees paid by the banks to the agencies for their trouble together with the promise of a continuing supply of products to rate would keep them well disposed to the bank and its products. The group of loans packaged up would be called Mortgage Backed Securities (MBSs) if made up of mortgages of varying quality, also called Collateralised Mortgage Obligations (CMOs), or Collateralised Debt Obligations (CDOs) if made up of different types of loan - mortgages, car loans, student loans, credit card loans etc. The collective name for these is asset backed securities (ABSs). In each case the investor would have the original assets in the package as collateral in the event of the provider going bust. Looking good!
But here the banks ran into another problem - the risk limits imposed by regulators. Note that the investors didn't buy any of the original loan agreements, those agreements stayed with the bank. The investors bought a contract, typically giving them the right to a rate of interest for a specific duration, after which the original cost of the contract would be repaid by the bank - just like any other loan agreement. The investors didn't in fact buy a slice of a package of loan agreements; they bought a slice of an income stream that was funded by a package of loan agreements. This is important because only the bank knew what was in the package of agreements, all the investors knew were the terms of the contract they had with the bank, the rating of it by the rating agency, and the fact that what they had bought was collateralised by loan agreements, but exactly what that collateral consisted of was unknown to them. In fact it was much worse even than that because for simplicity we have been considering the bank as the sole player in making the original debts available to investors. In fact there were dozens of players, all playing some part in the complex web of dealings, so neither the banks nor anyone else knew for certain what the packages contained. Unbelievable I know but true nonetheless! It was that ignorance that brought the world to within a whisker of economic collapse in 2008.
To see why risk imposed a limit we have to consider a bank's balance sheet. The money paid by the investor would largely appear as reserves thereby adding to the bank's capital, but those reserves would disappear again when another loan agreement was accepted and the borrower spent the money on a house, car or whatever, and the seller banked with a different bank. Over time the bank's balance sheet would show a growing number of loan agreements (risky assets) and a growing number of ABS liabilities, with the bank's risk-free capital base unable to keep pace. Therefore the ratio of risk-free assets to risky assets would keep dropping until the regulator stepped in to stop further growth.
Bright idea no. 4! Sell the risky loan agreements to a separate company, wholly owned by the bank but operating under a trust arrangement so that it could carry out business independently of the bank. These trusts were known as Special Purpose Vehicles (SPVs), and were not banks, so they could attract much higher levels of debt than could a bank as they weren't subject to any risk limitation. The SPV would initially borrow money, normally from the money market (because borrowing from banks would just load the banks back up with risky loan agreements) to buy the first batch of loan agreements, but would buy later batches using money from the investors who bought the ABSs. The effect for the bank was that the loan agreements (long-term risky assets) were removed from its balance sheet and replaced with money in the form of reserves (short-term safe assets) from the SPVs, which it could use to fund more loans. There was no limit to this process because the bank's risk limitation was no longer challenged. The effect for the SPV was a build-up of both long-term risky assets (loan agreements) and liabilities (ABSs), but this build-up wasn't a problem because it had no risk limitation to worry about. The SPV would normally work with other companies that did all the slicing, dicing and making the ABSs available to investors, and were located in tax-friendly environments so as to avoid paying what they owed to the country in which the loans were taken out[197]. Sorted!
As a further twist to the tale some investors wanted insurance against defaults, so a new derivative was invented for the purpose - the Credit Default Swap (CDS). In return for fees paid by the swap buyer to the swap seller for the duration of the contract, the seller would agree to make good all interest payments and the final capital repayment in the event of a default on the original debt contract. In effect the CDS buyer swapped the credit default risk that came with the ABS contract for a risk free contract with the CDS seller - the CDS seller taking over the risk in return for the fee that was paid. These were extremely popular and very lucrative for the sellers, notably American International Group (AIG), which collected fees without any thought that they might have to pay out. So confident were they that they were happy to issue CDSs to anyone who wanted them, regardless of whether or not they owned any ABSs. In other words in the event of a default on a debt contract the issuer would be required to pay many times over the value of the default. This was because such derivatives were classed as swaps, not insurance, which in reality they were. Anyone wanting insurance is required to own or at least have a material interest in the asset insured, if the insurance is classed as a swap then they don't. I have house insurance which gives me peace of mind, but I would have a good deal less peace of mind if I discovered that dozens of other people I didn’t even know had also insured my house! Anyone interested in this story is recommended to read 'The Greatest Trade Ever' by Gregory Zuckerman (Zuckerman 2010), which tells the story of the trader John Paulson who predicted the economic crash and made the biggest windfall in history, by betting against the market using CDSs.
Yet another complicating factor was that many non-bank finance companies also offered mortgages and other loans, and funded them initially by borrowing from the money market rather than by creating bank money. In that way they avoided falling foul of the client money rules (see chapter 47) - they didn't take deposits - so weren't regulated as banks and could therefore take bigger risks by operating with much less capital. Later, as they packaged, sliced and sold rights to the income stream from loans money would come in from investors so less would need to be borrowed from the money market. These companies offered credit to the borrowers but didn't create money because they lent existing money. However by means of the packaging and slicing process they created what is known as 'near money' - assets (i.e. ABSs) that are (or were at the time) easily exchanged for money in the market. In that respect they operated very much like traditional banks, not only offering long-term loans to borrowers but converting them into short-term liquid assets to sell to investors. This is another form of maturity transformation process that was discussed in chapter 40, but this time the liquid assets were near money rather than money itself.
The term 'near money' is interesting. It is considered by many that because financial institutions can easily create near monies in effect they create money, so there is no point trying to control banks' creation of money because others would just step in to create near monies which would defeat the object. In reality, as the 2008 crash so clearly showed, near money only deserves its name when everyone, buyers and sellers, believe in its worth. When there is doubt, as there was with ABSs in 2008, they become anything but near money! No-one would touch them at any price. There is no way that a non-bank can create money or genuinely near money that retains its value under all circumstances, because the only thing that holds its value in terms of money is money. I like the Positive Money definition of money - it is that which passes the 'Tesco Test' - if you can walk into Tesco's with it and buy a basket of groceries then it's money, if you can't then it isn't.[198] So called near money is no reason to give up on the ambition to control banks' money creation activities as discussed in the next chapter.
The above explanation is a very brief summary of the essence of what the banks and finance companies were up to. In practice it was immensely complex, with very many separate players involved (though several of them often owned by the same entity). The whole structure apart from the traditional banks became known as shadow banking because of the many players that weren't banks but in effect did business that was traditionally the preserve of banks. As an indication of just how complex the arrangements were, after the 2008 crash the Federal Reserve Bank of New York wrote a paper which is available online[199] and contains a map of the shadow banking system on a single sheet of A4, but in order to read the labels clearly this must be magnified 6 times to form a legible map of about 5 feet x 3 feet! I think it is fair to say that no-one understood or indeed understands the full complexity of all this. Individual players understood their own part in it and those they dealt closely with, but no individual needed to understand all of it, except in conceptual form. Figure 54.3 below gives an outline of the structure.
Although no-one understood it all the many players were very well rewarded for their efforts, and the final investors also enjoyed a handsome return, all funded by the borrowers at the bottom of the pile, and they are considered next.
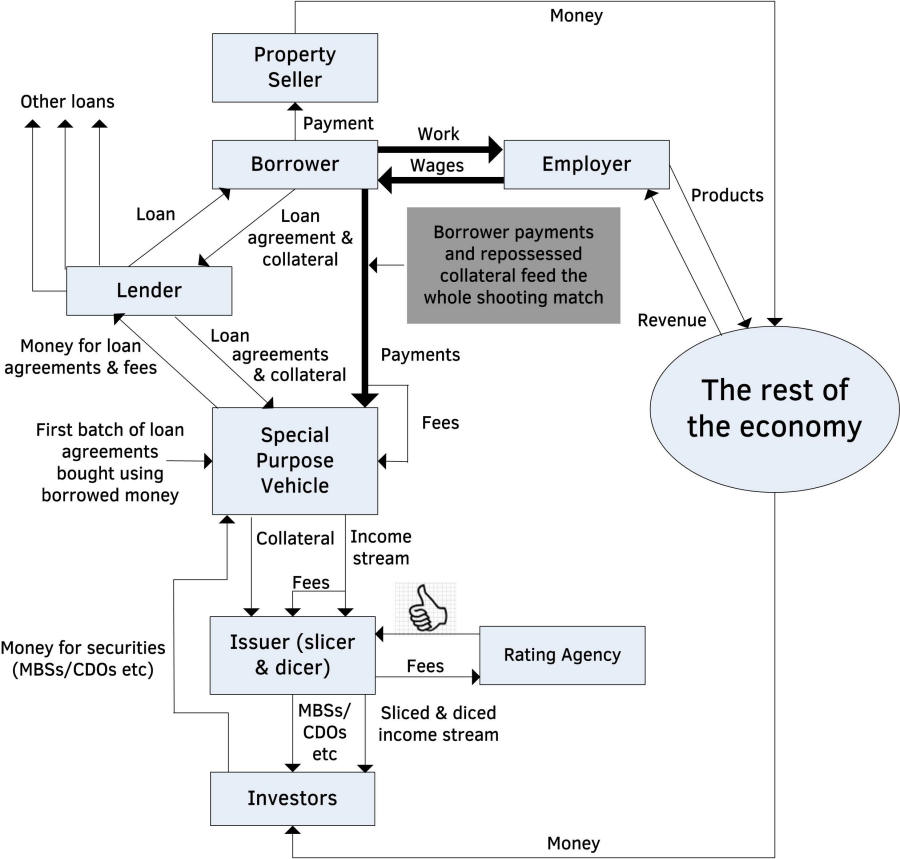
Figure 54.3: An outline structure of the securitisation process.
In order for the whole house of cards to stand up there has to be an increasing number of borrowers at the bottom, not only taking out new loans but also hopefully paying them back. If new borrowers can't be found then banks won't have anything new to package up and investors won't be able to continue investing in these products. The wonderful money-making machine would grind to a halt.
How can banks and investors be sure of a continuing supply of borrowers? Well here's the really clever part - clever that is in a deeply sinister sense - the more money that is in wealthy hands the more that ordinary people have to borrow it back in order to live a normal life. It is fuelled by the 'hoover-up' phenomenon - it's what neoliberals prefer to call 'trickle-down' - which we met in chapter 20, but here it became supercharged. This is how it works. Banks create new money and make it available to borrowers in return for loan agreements. These borrowers aren't investors so they spend the money mainly on new wealth - houses, cars, furniture, holidays, consumption goods, university education and many other things, but mainly houses. That expenditure helps the economy because it provides income for wealth producers. Even if the new money is spent on existing houses it eventually finds its way back into the economy when people at the top of housing chains downsize and spend the excess or they die and their offspring sell the property and spend their inheritance - though there can be a long delay as discussed in chapter 23 during which time house prices rise. The borrowers, in paying interest on the money borrowed, provide the income stream that provides all the fees to the banks and shadow banks, each taking their cut, with the residue going to the investors who buy the ABSs. In order to provide the income stream the borrowers must work in the economy, using a portion of their earnings for the purpose. Now that income stream in the hands of banks and investors represents money available for yet more loan agreements. At this point banks and borrowers together have injected new money into the economy which fosters growth, but also set up a process whereby a continuing flow of money runs from the debtors back to the banks and investors. With this process the banks are a lot less concerned about the creditworthiness of the borrowers because the default risk is transferred to the investors, so the new generation of borrowers consists of people who would have struggled to obtain loans in earlier times, but now see an opportunity to improve their lives using borrowed money - these are the people who represent the continuing supply of borrowers. The main purchase that borrowers make is houses, so with more willing buyers property prices rise, generating even bigger loans and also a 'feel-good' factor amongst home owners, and because home owners are voters the government feels good too. Existing property owners also join the party by re-mortgaging in order to spend their newfound 'wealth', except that their wealth hasn't changed at all, their house is still what it was before the price rise. All that has changed is other people's willingness to buy it, and willingness can disappear as fast as and usually much faster than it appeared. As investors notice that property prices are rising they see it as a good investment in its own right, so they also rush to buy property, assisted by banks offering 'buy-to-let' mortgages. People unable to buy their own property have to rent, which represents interest on the borrowed property, and as prices rise rents also rise. Note that property hasn't become more intrinsically valuable in terms of use value, its exchange value has risen purely because there are more willing buyers than willing sellers, all convinced that prices will rise yet further - the classic recipe for a bubble. As property prices rise in excess of inflation mortgage payments and rents take an even bigger slice of people's income and it all largely goes to banks and investors - this of course is no more than business as usual - take from the poor to give to the rich - but in the run-up to 2008 it was on steroids.
Although money used to buy ABSs was existing asset money (MEA), the BoE reserves that accompanied it were used by the banks to fund the creation of new money mainly for property purchase, so much of this new money became new wealth money (MNW) when it was spent in the economy by the new house builders and existing house sellers. That was why there was economic growth in this period - whenever money is taken from the stock of MEA to increase MNW then growth is fostered provided that there is spare capacity to absorb it - see chapters 23 and 24.
Note that although bank money is created when a loan is made, it is destroyed again when investors buy ABSs - recall the general rule that a bank creates money when it pays out in bank money and destroys money when it receives payment in bank money, see chapter 44. ABSs represent debts sold by banks (or Special Purpose Vehicles on banks' behalf). Therefore although the total value of debts was increasing the total value of money was not increasing at the same rate, so the danger of rampant inflation was much less, and indeed didn't happen apart from in property and asset prices. Other institutions than banks also offered mortgages and sold ABSs - shadow banks - but in their case no money was created or destroyed, so again the overall money supply wasn't affected although debts still mounted.
Banks were significant buyers of ABSs because they were rated highly and therefore didn't harm the risk ratio as much as the underlying loan agreements would have done, so when doubts arose as to their real value those doubts also fell on the value and solvency of banks. It was those ABSs - toxic assets - that eventually crashed the system.
Because people need somewhere to live they must either borrow the property and pay rent on it, or borrow the money to buy it, as indeed they always have done. But with the advent of easier credit for less creditworthy borrowers and easily available buy-to-let mortgages - making property a much more popular investment - demand for it increased and prices rose considerably in consequence. Rising prices mean bigger mortgages and higher rents, and a higher proportion of people's wages used to pay for them, money that flows back to banks and investors. This money is then available for further investment in mortgages and property and so up go property prices again, and up go the mortgage payments and rents and so on in an ever-increasing spiral. The driver at the bottom is people's need for somewhere to live and the effect is an accelerating accumulation of debt and therefore an ever-increasing proportion of their earnings taken by banks and investors. Figure 54.4 shows this as the house price to earnings ratio for first-time buyers (FTBs).
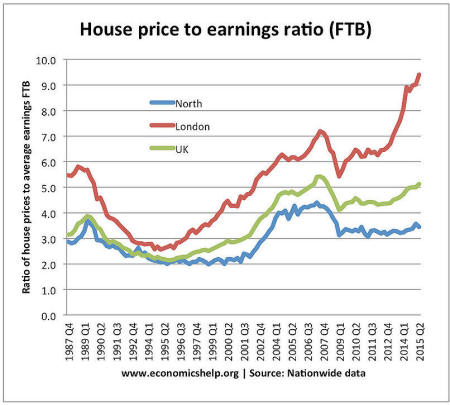
Figure 54.4: House price to first-time buyer earnings ratios for London, the North and UK as a whole. Source Economics Help website by Tejvan Pettinger, retrieved from http://www.economicshelp.org/blog/5709/housing/market/
The relentless rise from 1994 to 2007 is clearly seen, amplified as ever for London property, and after the dip which lasted until 2009 it has remained fairly static for the north but taken off again and climbed even higher than before the crash for London.
People are forced to borrow either money or property from those who own it, and pay them handsomely and in increasing amounts for the privilege. With so much money circulating around the economy the rate of interest was low during this period - see Figure 54.2 - so the amount of debt was able to rise to unprecedented levels - people's ability to repay depends on the level of interest payments rather than the level of debt, so with low interest debt can be very high.
Figure 54.5 below shows the accelerating trend in household debts and the increasing gap between debt and income until it was stopped by the crash of 2008. Income is now catching up slowly but the level of debt remains very high. Note though that the income in the chart is an average so it includes the income of the wealthy, therefore non-wealthy income isn't rising at anything like the same rate.
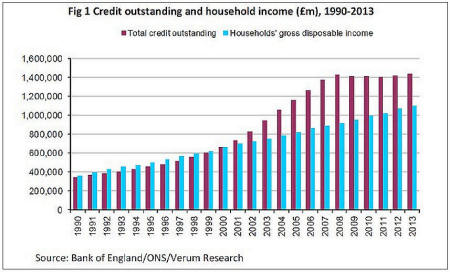
Figure 54.5: Household debt (credit) outstrips household income. Retrieved from http://www.thisismoney.co.uk/money/news/article-2724894/Families-red-pose-threat-UK-recovery-household-debt-quadruples-1990.html
Figure 54.6 shows house prices keeping pace with the growth in household debt up to 2008, indicating that the bulk of loans were to buy property.
Note that these charts don't include borrowed property as debt, although that's what it is because interest in the form of rent is payable on it, so in reality the aggregate household debt burden is and was considerably higher than indicated.
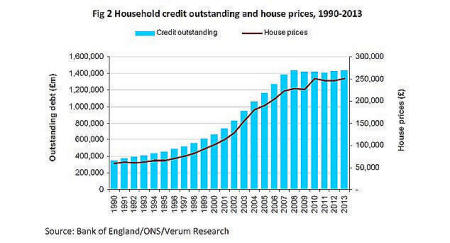
Figure 54.6: Household debt (credit) and house prices remain closely linked. Retrieved