UNSURFACED ROAD CONDITION SURVEY AND RATING PROCEDURES
3-1. General
has times of the year when unsurfaced roads need
This chapter explains how to conduct a condition
regular maintenance to keep them usable, such as
survey inspection and how to determine the Un-
the spring “mud season” in New England, keep
surfaced Road Condition Index (URCI). It is essen-
track of where the maintenance was done so that
tial to have a thorough working knowledge of the
those areas can be inspected during the windshield URCI and condition survey inspection techniques.
survey. These inspections should be made four
An important component of the unsurfaced road
times a year-once each season. The results can be
maintenance management system is the surface
used for estimating maintenance needs and priori-
condition survey and rating procedures. Data ob-
ties.
tained from these procedures are the primary basis (2) The detailed sample unit measurements
for determining M&R requirements and priorities.
necessary to compute the ratings should be con-
ducted annually. Always make these measure-
3-2. Unsurfaced road condition rating
ments at the same time of year-when the roads
Surface condition is related to several factors,
are in their best and most consistent condition. To including structural integrity, structural capacity, make the measurements, the inspector will need to
roughness, and rate of deterioration. Direct mea-
recognize certain kinds of problems, which are
surement of all these factors requires expensive
called distresses. The seven distress types for equipment and highly trained personnel. However,
unsurfaced roads are as follows.
these factors can be assessed by observing and
(a) 81-Improper cross section.
measuring the distress of the surface.
(b) 82-Inadequate roadside drainage.
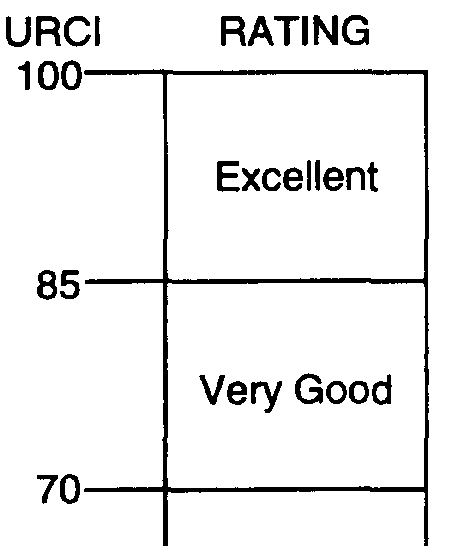
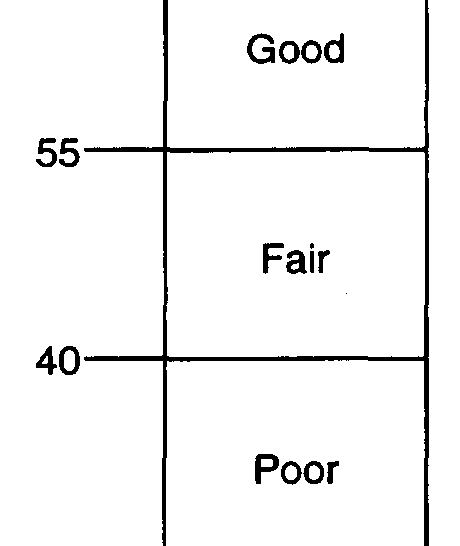
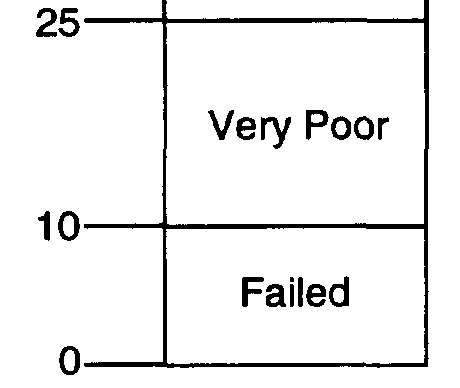
a. URCI. The unsurfaced road condition index is (c) 83-Corrugations.
a numerical indicator based on a scale of 0 to 100.
(d) 84-Dust.
The URCI indicates the road’s integrity and sur-
(e) 85-Potholes.
face operational condition. Its scale and associated (f) 86-Ruts.
ratings are shown in figure 3-1 and is identical to (g) 87-Loose aggregate.
the Pavement Condition Index (PCI) for surfaced
(3) The descriptions and severity levels for
roads.
each are given in appendix B. Since the URCI is
b. Determination. of URCI. The URCI is deter-based on these descriptions, it is imperative that mined by measuring surface distress. The method
the inspector follow appendix B closely when doing has been field tested and has proven to be a very
an inspection. The distresses are numbered 81-87,
useful device for determining M&R needs and
as those are the numbers assigned in Micro
priorities.
PAVER.
(4) The equipment needed to do a survey is a
3-3. Unsurfaced road inspection
hand odometer (measuring wheel), used to mea-
Before an unsurfaced road network is inspected, it sure distress lengths and areas, a straight edge,
must be divided into branches, sections, and sam-
and a ruler to measure the depths of potholes,
ple units as described in chapter 2. Once this
ruts, or loose aggregate, and the URCI distress
division is complete, survey data can be obtained
guide (appendix B).
and the URCI of each section determined.
(5) DA Form 7348-R, (Unsurfaced Road In-
a. Inspection procedures for unsurfaced roads.
spection Sheet) should be used to record inspection There are two methods of inspections. The first is data for each sample unit. (A copy of DA Form
a quick survey done from a moving vehicle. The
7348-R is available at the back of this manual. It second involves detailed measurements of dis-will be locally reproduced on 8 1/2- by 11-inch
tresses in the sample units.
paper.) The sample unit shown in figure 3-2 has
(1) To do the “windshield inspection,” drive
100 feet (30 meters) of medium severity improper
the full length of the road (or branch) at 25 miles cross section (distress 81), 200 feet (61 meters)
per hour (40 kilometers per hour). (The speed may
(both ditches) of high severity inadequate roadside be higher or lower depending on road conditions,
drainage (distress 82), low severity dust (distress local practice or speed limits).’ Note any surface or 84), 490 square feet (45.5 square meters) of me-drainage problems along the road. If the local area dium severity rutting (distress 86), and 910 square feet (84.5 square meters) of high severity rutting 3-1
TM 5-626
site-for example, if two distresses occur together, such as ruts and potholes, or if there is standing water in a ditch line.
(4) If two or more distresses occur together,
measure each one separately. If it is hard to
determine what distress is being observed, make a
reasonable estimate-the system is flexible enough
to calculate an accurate rating.
3-4. Calculating the URCI From inspection re-
sults
a. General. The distress measurements are used to calculate the Unsurfaced Road Condition Index
(URCI), based on deduct values. A deduct value is
a number from 0 to 100, with 0 meaning that the
distress has no impact on the road condition and
100 meaning that the road has completely failed.
b. Calculating sample unit URCI. This calculation is made in four steps. Following is an example using figure 3-3.
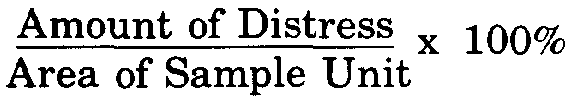
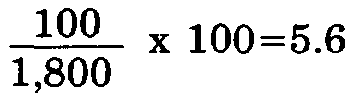
(1) Step 1. Calculate the density for each distress type (except dust).
Density =
(eq. 3-1)
In this example the density of each distress and
severity level is based on a sample unit of 1,800
square feet (167.4 square meters).
(a) For 100 linear feet of improper cross section (distress type 81), the density is
(eq. 3-2)
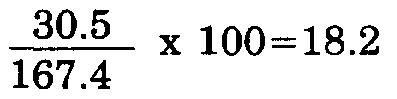
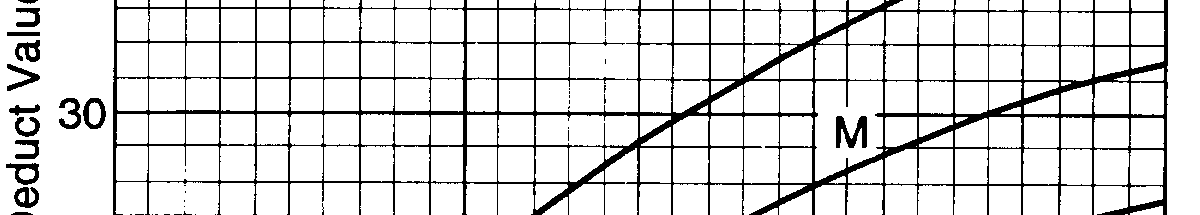
(b) For 30.5 linear meters of improper cross Figure 3-1. URCI scale and condition rating.
section (distress type 81), the density is
(distress 86). The units of measure are shown in
(eq. 3-3)
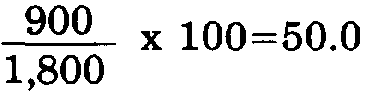
parentheses after each distress type listed on the top part of the sheet. The total distress data are (c) For 900 square feet of corrugations (dis-used to compute the URCI for the sample unit.
tress type 83), the density is
That computation is explained in paragraph 3-4.
b. Remarks.
(eq. 3-4)
(1) For unsurfaced roads, it is important that
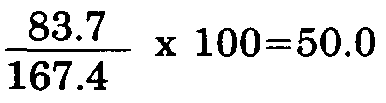
each sample unit be identified precisely so that it (d) For 83.7 square meters of corrugations can be located for reinspections. A stake, pin, or (distress type 83), the density is
other permanent marker should be placed behind
the ditch line at one of the four sample unit
(eq. 3-5)
corners and distance noted to the nearest perma-
(e) No density calculation is needed for dust nent marker (culvert, bridge, etc.) or intersection.
(distress type 84).
A sketch of each section should also be made to
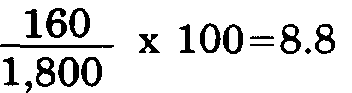
(f) For 160 linear feet of loose aggregate show sample unit locations.
(distress type 87), the density is
(2) It is imperative that the distress descrip-
tions listed in appendix B be used when doing
inspections. If these definitions are not followed, (eq. 3-6)
an accurate URCI cannot be determined.
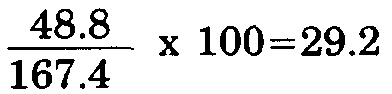
(g) For 48.8 linear meters of loose aggregate (3) Make notes about anything unusual at the
(distress type 87), the density is
3-2
TM 5-626
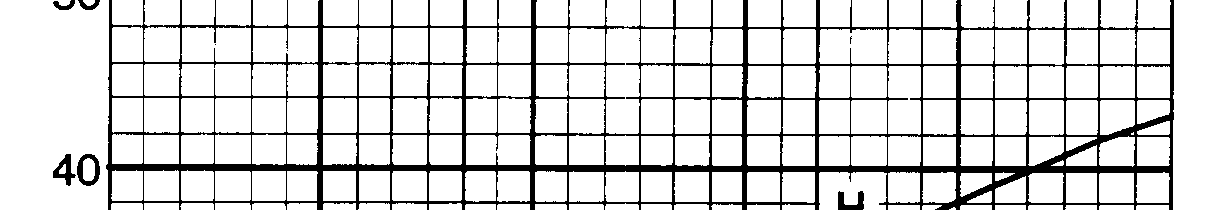
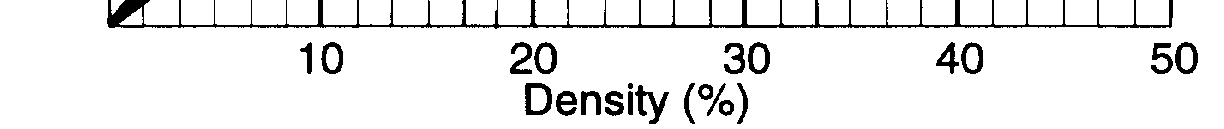
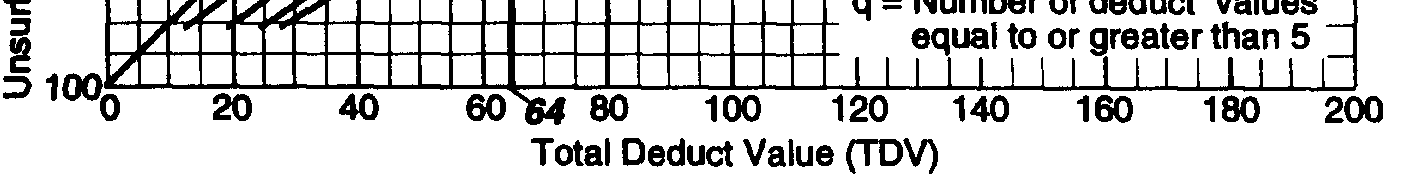
(3) Step 3. Find the Total Deduct Value (TDV) (eq. 3-7)
and the q value. Calculate the TDV by adding up (2) Step 2. Using the deduct value curves, find all the deduct values. The q value is the number of the deduct values for each distress type and
individual deduct values greater than 5.0.
severity level. The deduct value curves are in
(a) TDV = 13 + 29 + 4 + 18 = 64 (which is appendix C .
the same in English and metric).
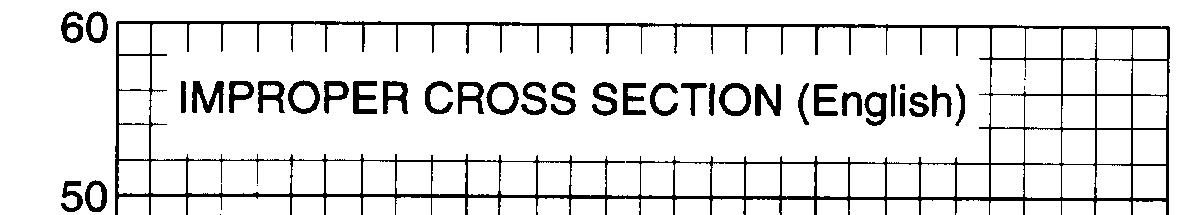
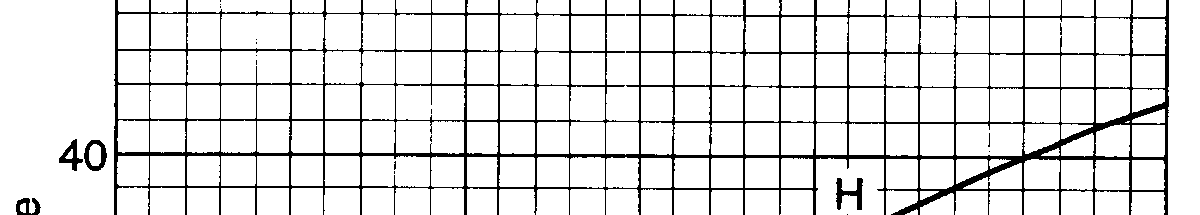
(a) For improper cross section at low sever-
(b) The q value is 3 because three deduct ity, locate on figure 3-4 (English units) the density values are greater than 5.0.
of 5.6 on the horizontal axis, go vertically upward (4) Step 4. Find the Unsurfaced Road Condi-to the low severity curve, then go left horizontally tion Index (URCI) from the URCI curve. (NOTE:
to the y-axis intersection, which gives a value of Slightly higher URCIs may result from manual
13 (English units). Similarly, for the metric sys-
computations.)
tem, locate on figure 3-4 (metric units) the density (a) From figure 3-5, the TDV is 64 and q is of 18.2 on the horizontal axis, which gives a value 3, so the URCI curve shows that the URCI is 59.
of 13.
From figure 3-1, the rating is “good.”
(b) For corrugations at medium severity, the (b) This is the rating for this sample unit.
deduct value is 29 (fig C-3).
The rating for the section is the average of the
(c) For dust at medium severity, the deduct ratings from all the sample units in the section.
value is 4 (fig C-4).
For example, URCIs of 63, 59, and 67 in a section
(d) For loose aggregate at medium severity, would give an average URCI of 63 for the whole
the deduct value is 18 (fig C-7).
section.
3-3


TM 5-626
Figure 3-2. Example of completed inspection sheet (English units).
3-4


TM 5-626
Figure 3-2. Example of completed inspection sheet (metric units).
3-5


TM 5-626
Figure 3-3. Example for calculating density of distresses (English units.).
3-6


TM 5-626
Figure 3-3. Example for calculating density of distresses (metric units).
3-7

TM 5-626
Figure 3-4. Distress 81-improper cross section deduct values curves (English and metric units).
3-8
TM 5-626
Figure 3-5. URCI curve.
3-8
TM 5-626