Chuan-Gen Lű
Jiangsu Academy of Agricultural Sciences, Nanjing,
P.R. China
1. Introduction
Temperature affects not only the growth rate, but also reproductive development of rice.
When temperature was higher than a critical point value during 5-15 days before heading,
rice thermo-sensitive genic male sterile (TGMS) line showed pollen sterility. Otherwise, it would be fertile (Lu et al 2001). The relationship between temperature and plant growth or reproductive development is usually studied by using a thermometer screen at a weather
station placed at height of 150 cm (TA), although a few studies were also performed to
describe more direct and accurate effects of micro-climate temperature at rice canopy on
plant growth and reproductive development.
Plant temperature (Tp) is regulated by various factors including solar radiation, cloud cover, wind speed, soil heat flux, and transpiration of plant. Besides, temperature and flow
velocity of irrigated water have significant effects on rice Tp. Many methods and simulations on Tp have been reported (Cellier 1993, Cui et al 1989, Ferchinger 1998, Hasegawa 1978, Leuning 1988a, 1988b, Lu et al 1998, Tetsuya et al 1982, Van et al 1989, Wei et al 1981, Zhao et al 1996). Tp was used as the index of water supply regime for wheat or corn (Cheng et al 2000, Huang et al 1998, Shi et al 1997, Yuan et al 2000), freezing injury or grain filling rate of wheat (Feng et al 2000, Li et al 1999, Liu et al 1992, Xiang et al 1998, Xu et al 2000). In recent studies, it was found that the fertility alteration of rice TGMS line was sensitive to Tp (Lu et al 2007, Xu et al 1996). Lu et al (2004, 2007) found that the sterility of TGMS was simulated more accurately by temperature at stem part of 20 cm height or air temperature (Ta) around the part when compared with TA at a weather station (Lu et al 2004, 2007, Zou et al 2005). So far, little is known about how Tp is regulated by microclimate or irrigated water (Hu et al 2006).
2. Plant temperature and its simulation model of thermo-sensitive male
sterile rice
The present chapter was performed to investigate the temporal and spatial distribution of Tp and its relationships with microclimate of canopy and irrigated water by using a TGMS line under irrigated and non-irrigated conditions. Two models were established to understand
how Tp is regulated by environments.
A TGMS rice line, Peiai64S, was used as plant material. Flowing irrigated water depth of 10-15 cm was treated, and no irrigated (keeping humid) was treated as control.
Tp and microclimatic factors were determined as below:
162
Agricultural Science
Tp: PTWD-2A sensors were inserted in stem sheaths at heights of 10 cm, 20 cm, 30 cm and 40
cm, respectively, to measure Tp.
Air, water and soil temperatures: PTWD-2A sensors were placed at 10 cm and 5 cm under
the ground, and 5 cm, 20 cm, 40 cm, 60 cm, 100 cm, 150 cm above the ground, respectively, to measure temperatures of soil, water and air.
Wind speed: EC-9S sensors were used to measure wind speed at height of 150 cm.
All above data were obtained using TRM-ZS1, automatically collecting every 10 seconds
and storing every 10 minutes.
When 50% of flag leaves appeared perfectly, five plants were sampled and dissected at
height of each 10 cm to determine layered LAI. Layered LAI was determined with
traditional method, i.e., calculated according to the dry matter of harvested layer and the specific leaf area of each layer from sampled leaves (SLA).
2.1 Change of rice Tp
2.1.1 Daily change of Tp
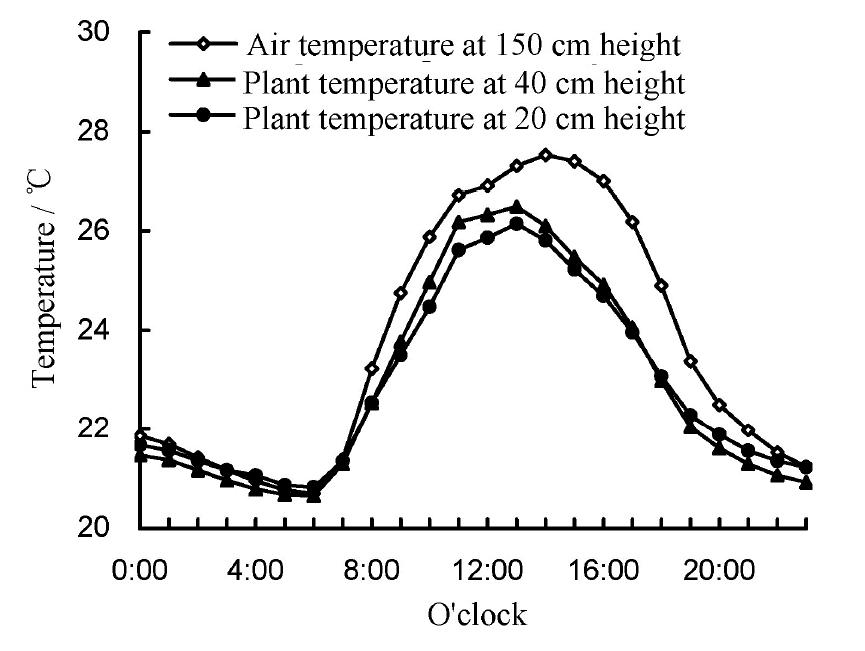
Fig. 1 showed the daily changes of air temperature at height of 150 cm (TA) and Tp at
heights of 20 cm and 40 cm (Tp20 and Tp40) under non-irrigated condition. The data were
collected from random 30 days, during which 11 d were sunshine, 9 d were cloudy, and
10 d were overcast. Tp showed different value from TA, although they had a similar trend
in daily change. TA and Tp could be simulated by using same parameters and a similar
equation.
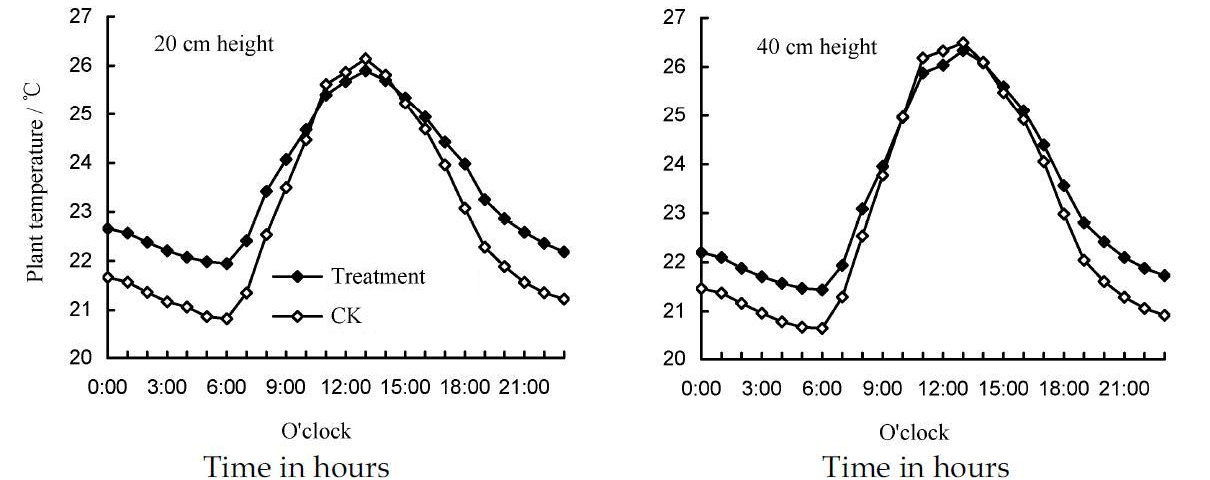
Fig. 1. Daily change of air temperature at 150 cm and plant temperature at 20 cm, 40 cm
heights.
Calculated the data of Fig. 1, result showed that, during 08:00-20:00, Tp was significantly lower than TA. Tp20 was lower than TA by an average of 1.44°C and the largest margin of
2.3°C, while Tp40 was lower than TA by an average of 1.25°C and the largest margin of 2.1°C.
Plant Temperature for Sterile Alteration of Rice
163
During 21:00-07:00, Tp20 and Tp40 were lower than TA only by 0.27°C and 0.06°C,
respectively.
Fig. 1 and its simulation equations (1), (2), (3) showed that, during daytime (06:00-18:00), the variation of both Tp and TA fit the sinusoid curve, but the coefficient showed TA>Tp40>Tp20.
During night time (18:00-06:00), the variation of both Tp and TA fit the exponent curve, but the coefficient showed TA>Tp40≈Tp20. The simulation equations and their effects were
described as follows:
20.8 5.3sin( t 5.78)/14.44 06 : 00 t 18 : 00
p
T 20 19.54 2.3exp (
t 6) / 4 /0.94
t 06 : 00 R2=0.956**
(1)
19.54 2.3exp ( t 18)/4
/0.94
t
18 : 00
20.7 5.8sin( t 5.78)/14.44 06 : 00 t 18 : 00
p
T 40 19.38 2.3exp (
t 6) / 4 /0.94
t 06 : 00 R2=0.957**
(2)
19.38 2.3exp ( t 18)/4
/0.94
t
18 : 00
20.7 6.8sin( t 5.78)/16.44 06 : 00 t 18 : 00
A
T 19.32 4.2exp (
t 6) / 4 /0.94
t 06 : 00 R2=0.972**
(3)
19.32 4.2exp ( t 18)/4
/0.94
t
18 : 00
Differences (visual temperature difference from thermometer, >0.2°C) were detected in
value and time between the maximum Tp and the maximum TA. The daily maximum value
was 26.1°C for Tp20, and 26.5°C for Tp40, whereas the maximum value was 27.5°C for TA. The maximum value of Tp occurred at 13:00, 1 h earlier than that of TA. Their minimum values, however, both appeared at 06:00. The fluctuation in daily change also showed significant
difference: TA (6.8°C)>Tp40 (5.8°C)>Tp20 (5.3°C).
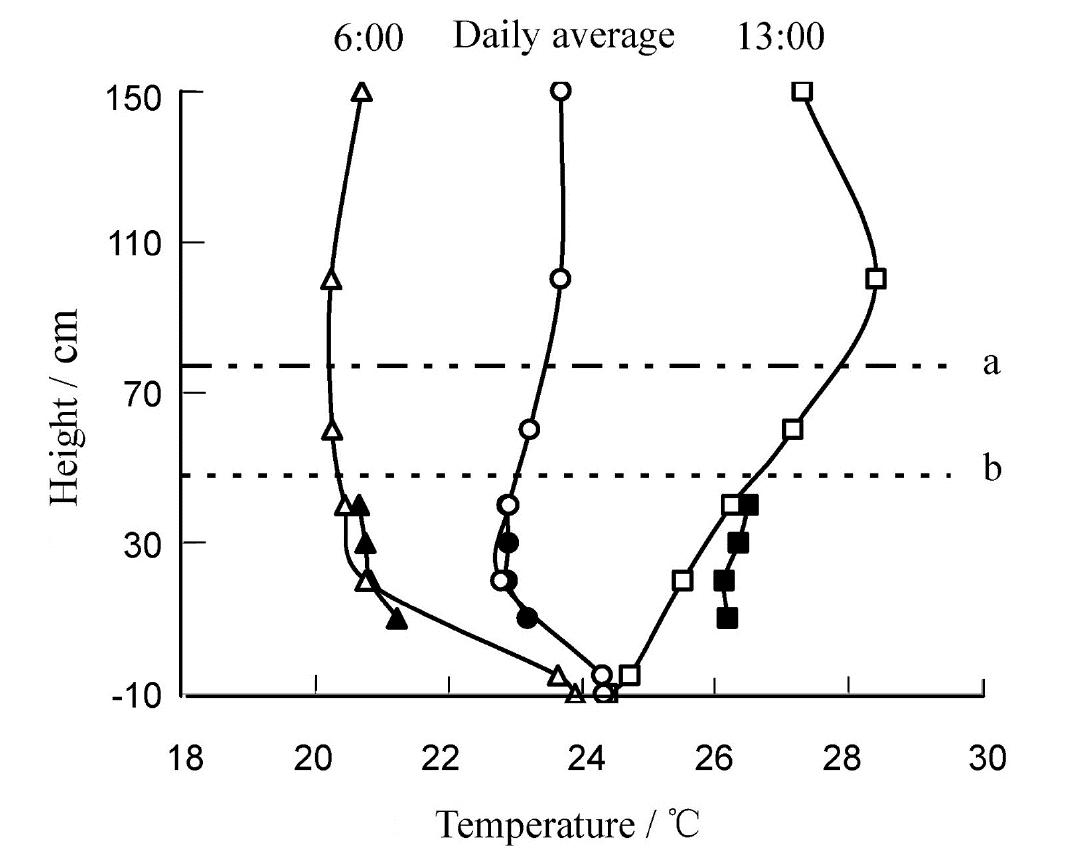
2.1.2 Difference of Tp at vertical height
Fig. 2 showed Tp and Ta at different heights observed at 06:00 and 13:00 under non-irrigated condition (30 d, same as Fig.1). Although the differences between Tp and Ta were not
significant, Tp at 13:00 at heights of 10 cm, 20 cm, 30 cm and 40 cm were all higher than Ta at corresponding heights without exception. Tp40 and Tp20 were higher by 0.24°C and 0.60°C,
respectively. The decreased rate of Tp (0.1°C /10 cm) was lower than that of Ta (0.41°C /10
cm). At 06:00, Tp at 30-40 cm was higher than Ta, whereas it showed an opposite difference at 10-20 cm.
2.2 Effects of environmental factors on Tp
Solar radiation and irrigated water were two main heat sources affecting rice Tp. Cloud
cover, wind speed and LAI of canopy also affect Tp by regulating heat transmission or
radiation intensity. Temperature and flowing speed of irrigated water were two main
factors regulating Tp.
164
Agricultural Science
Fig. 2. Plant (▲●■) and air (△○□) temperatures at different heights. a and b lines
denotes plant height and layer of maximum leaf density, respectively.
2.3 Effects of Ta on Tp
2.3.1 Change of Ta and its effects on Tp
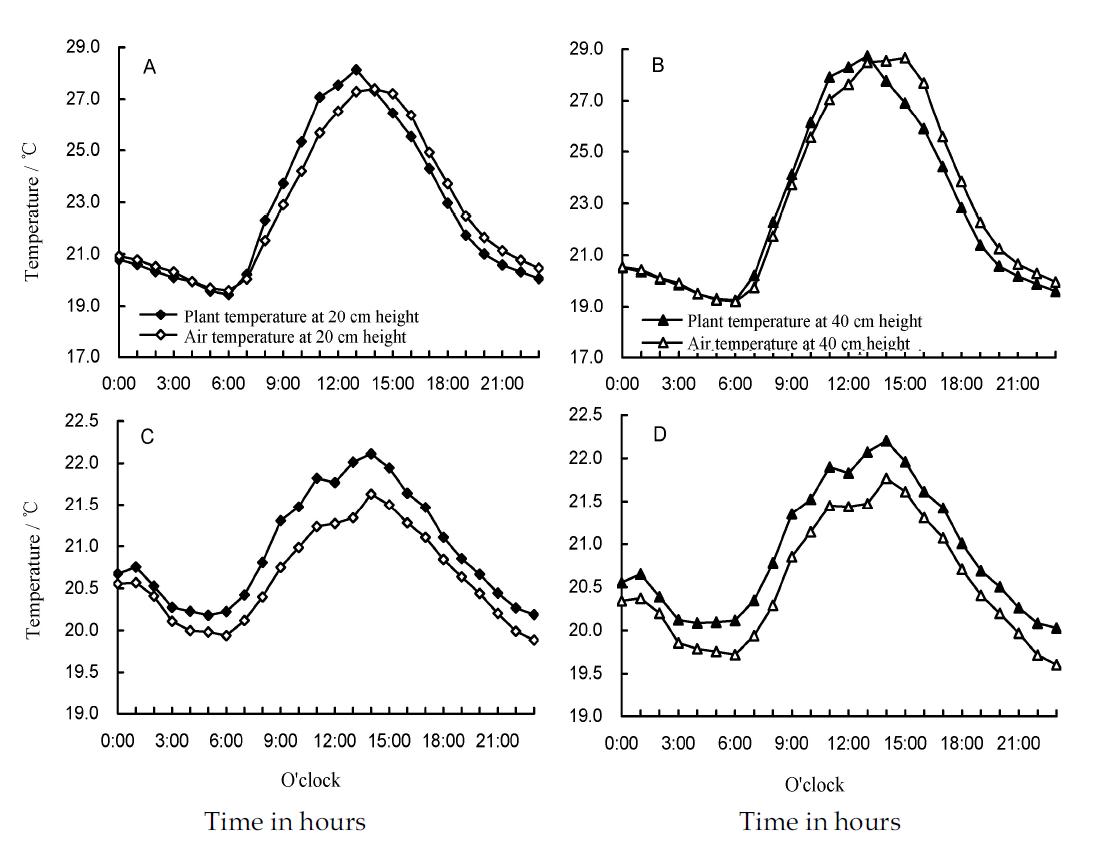
Fig. 3 showed daily changes of Tp and Ta at heights of 20 cm and 40 cm under sunshine (11
d) and cloudy (10 d) days. During 06:00-13:00 in sunshine days, Tp was increased earlier
than Ta by 1 h, and Tp was maximized at 13:00 (28.1°C for Tp20, and 28.7°C for Tp40). In
contrast, Ta was increased later than Tp by 1 h, and Ta was maximized at 14:00 (27.4°C for Ta20, and 28.5°C for Ta40). Besides, the raising intensity was Tp stronger than Ta by 0.7°C (20
cm) and 0.2°C (40 cm). Tp showed close to or even little lower than Ta during night time
(18:00-06:00). The significant difference between Ta and Tp during daytime might be caused by the larger absorption of solar radiation by plant than air. When the heat was absorbed, the plant released its energy in long wave, which resulted in an increase of Ta around the plant. After 13:00, along with the diminishing of solar radiation, Tp began to decrease but Ta was reacted dully (decreased one or two hours later under sunny days). Under cloudy days, Tp was higher than Ta all the day. At heights of 20 cm and 40 cm, Tp was 0.4°C higher on
average, and the maximum one by 0.5°C for Tp20 and 0.4°C for Tp40, and the minimum one
by 0.3°C for Tp20 and 0.4°C for Tp40, respectively. This suggested that there was a weak
exchange between plant and air on cloudy days.
Plant Temperature for Sterile Alteration of Rice
165
A and B denote sunny day with sunshine time >8 h; C and D denote overcast day with no sunshine time.
Fig. 3. Daily change of air and plant temperature at 20 cm and 40 cm heights.
2.3.2 Statistical relation of Tp to TA
In the present chapter, Tp at 20 cm and 40 cm, and TA at 150 cm observed at 06:00 and 13:00
were used to establish linear regression equations. Results showed that the regression
coefficient of Tp40 was lower than that of Tp20, confirming that solar radiation was the key resource of heat in plant.
06:00 Tp:
20 cm: Tp20 =0.9949 TA + 0.1741 R² = 0.992**, n = 30
40
cm:
Tp40 =0.9670 TA + 0.8885 R² = 0.995**, n = 30
13:00 Tp:
20 cm: Tp20 =0.9338 TA + 2.3121 R² = 0.973**, n = 30
40
cm:
Tp40 =0.9199 TA + 2.3416 R² = 0.982**, n = 30
Daily average: 20 cm: Tp20 =0.9338 TA + 1.6011 R² = 0.996**, n = 30
40
cm: Tp40 =0.9205 TA + 1.7991 R² = 0.997**, n = 30
166
Agricultural Science
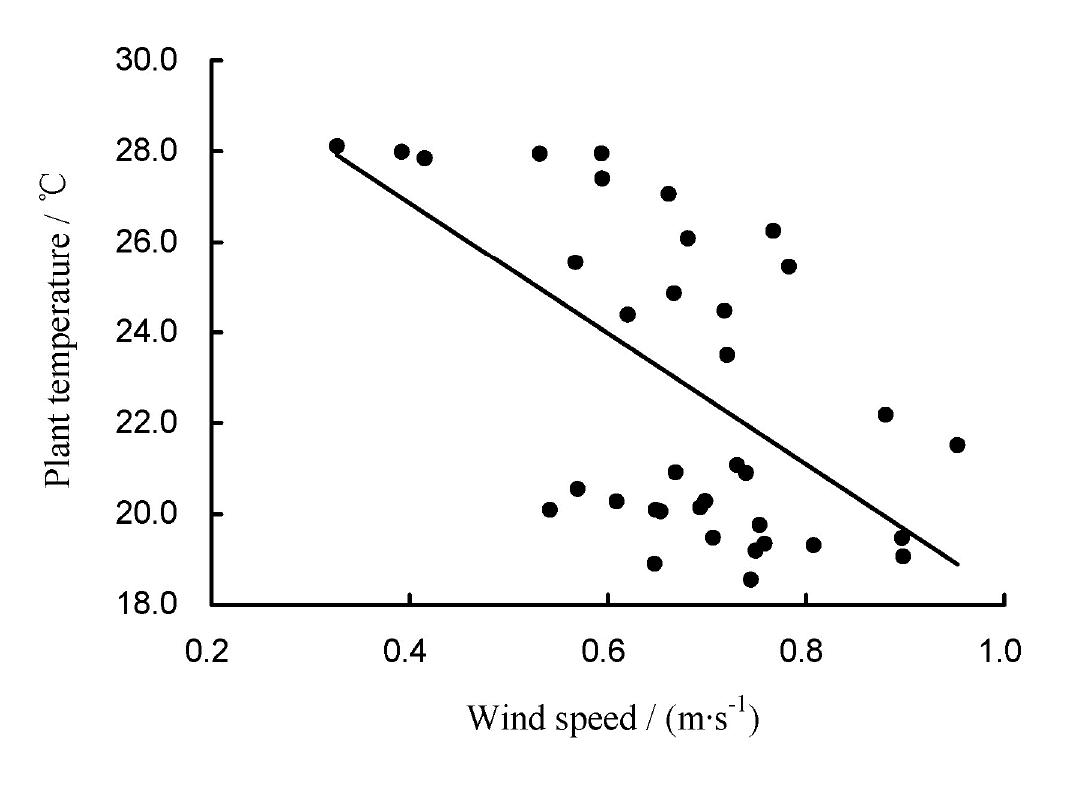
2.4 Effect of wind speed
Fig. 4 showed the relationship between Tp20 and wind speed at 150 cm (V). The equation
was: Tp20 = -14.411 V +32.622 ( R2=0.334*, n=39). The result indicated that wind speed on the top of canopy had a significant effect on Tp.
Fig. 4. Relationship between plant temperature at 20 cm and wind speed at 150 cm.
2.5 Effects of irrigated water
Irrigated water was another important effect regulating rice Tp. Water temperature (Tw) and Ta were varying in different manners, which resulted in a remarkable difference in their
effects on Tp.
2.5.1 Temporal change of effects of irrigated water on Tp
Fig. 5 showed daily varying curves of Tp (30 d) at 20 cm and 40 cm of plants grown with
and without irrigated water. The average temperature of inflow water was 26.9°C (21.5-
34.0°C), and TA was 23.7°C (13.5-36.5°C). Irrigated water increased Tp at 20 cm and 40 cm by 0.7°C and 0.5°C, respectively, or by 0.35°C and 0.25°C, respectively, for per 1°C of
water-air temperature margin. The effect of increased Tp by irrigated water was higher at night than at daytime. Tp20 was increased by 1.01°C during 19:00-05:00, and by 0.37°C
during 06:00-18:00, but decreased by 0.19°C during 11:00-14:00. At 40 cm, Tp40 was
increased by 0.77°C during 19:00-05:00, and by 0.20°C during 06:00-18:00, but decreased
by 0.25°C during 11:00-13:00. The results showed that irrigated water had more significant effects on Tp during night than daytime. In daytime, solar radiation partly withstood the effects of water irrigated. At the noon when solar radiation was the maximum, irrigated
water decreased Tp.
Plant Temperature for Sterile Alteration of Rice
167
Fig. 5. Daily change of plant temperature at 20 cm and 40 cm under irrigated treatment and non-irrigated conditions.
2.5.2 Effects of irrigated water on Tp at vertical height
Tp (30 d, same as Fig. 1) at four heights at 06:00 and 13:00 was compared between irrigated and non-irrigated conditions (Table 1). The effect of irrigated water on Tp was decreased lower along with the increase of height. It was a difference by 2.5°C at 10 cm, 0.6°C at 20 cm, 0.5°C at 30 cm, and 0.4°C at 40 cm. At 06:00, irrigated water could increase Tp (increasing rate of 3.7°C
at 10 cm), but the increasing rate was lowered along with the increasing of plant height.
Around noon, Tp showed 0.7°C increase at 10 cm but a decrease at 20-40 cm. The effect of
irrigated water on Tp was stronger at the lower site than at the higher site in plants.
Item 06:00
13:00
Daily
average
Irrigated 10 cm
24.7±9.4
26.9±7.6
25.7±8.3
Tp10
Non-irrigated 21.2±8.5 26.2±8.0 23.2±7.6
Difference 3.5±3.9
0.7±3.5 2.6±2.2
Irrigated 10 cm
21.9±8.7
25.9±7.9
23.5±8.0
Tp20
Non-irrigated 20.8±8.4 26.1±8.1 22.9±7.5
Difference 1.1±1.5
-0.2±1.9 0.7±1.0
Irrigated 10 cm
21.8±8.4
26.0±7.4
23.4±7.6
Tp30
Non-irrigated 20.8±8.3 26.4±8.6 22.9±7.6
Difference 1.0±2.3
-0.3±2.0 0.5±1.0
Irrigated 10 cm
21.4±8.3
26.3±8.3
23.3±7.7
Tp40
Non-irrigated 20.7±8.4 26.5±8.6 22.9±7.6
Difference 0.8±1.0
-0.2±1.0 0.5±0.5
Note: Difference: difference of plant temperature between irrigated water of 10 cm depth and non-irrigated.
Table 1. Comparison of plant temperature observed at four heights at 06:00 and 13:00
between irrigated and non-irrigated conditions
168
Agricultural Science
2.5.3 Effects of irrigated water temperature on Tp
Irrigated water temperature also regulated Tp, due to the difference between water and air temperature. The simulated equation between water-air temperature difference (Tw-A) and
0.5
T 10.6
average T
A
0.048
A of 117 days was: T 25.8
1 (
)
w A
( R2=0.422**, n=117), based
19.0
on the weather record (TA from 17.4-30.5°C with the average of 23.7±8.6°C, Tw from 22.2-
31.9°C with the average of 26.9±6.7°C). It implied that, when TA=29.6°C, then Tw-
A=0°C;when TA>29.6°C, Tw-A was lower than TA, irrigated water decreased Tp.
Conversely, when TA<29.6°C, irrigated water increased Tp. When TA decreased from
29.6°C, Tw-A would be decreased in power. When TA decreased from 27.4°C to 22.0°C
(decreased by 5.4°C), Tw-A was enlarged from 2°C to 4°C. When TA decreased from 16.5°C to 12.9°C (decreased only by 3.6°C), Tw-A was enlarged from 6°C to 8°C. Obviously, the regulatory effect would be enlarged under a lower TA.
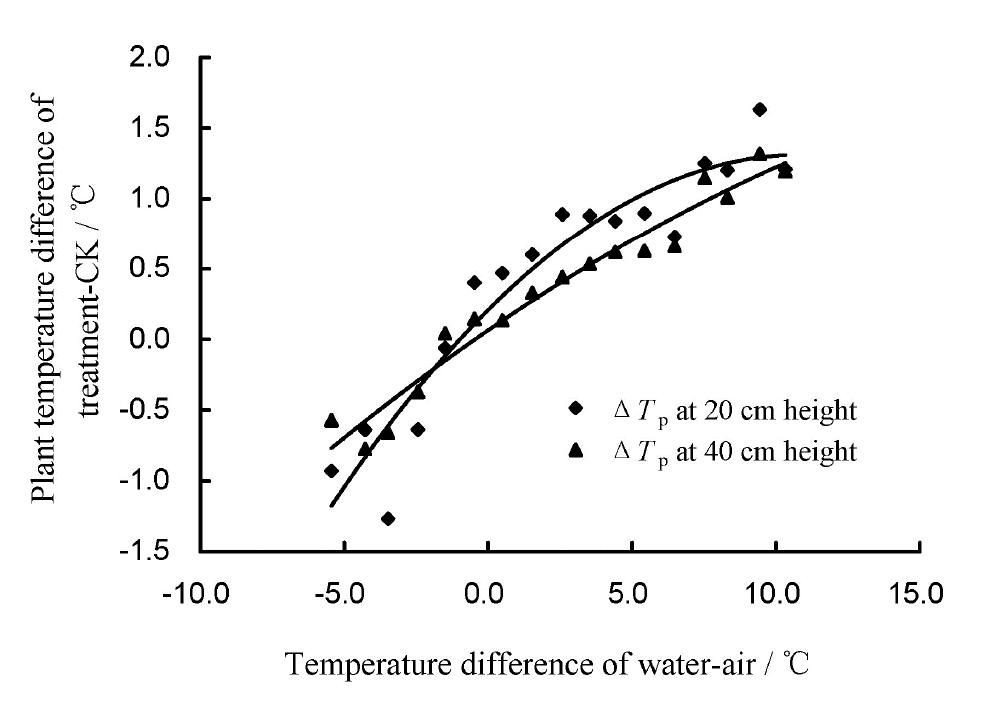
Fig. 6 showed the relationship in Tp difference (at 20 cm and 40 cm) between irrigated and non-irrigated (ΔTp) and the difference between water-air temperature (Tw-A, average value of 720 samples) (equation 4 and 5). The results showed that, in a range of (-5.45°C)–
(+10.32°C) for Tw-A, ΔTp and Tw-A showed a significant conic relationship. When Tw-A= -5°C, ΔTp at 20 cm and 40 cm was -1.10°C and -0.71°C, respectively. When Tw-A=5°C , ΔTp at 20 cm and 40 cm was 0.84°C and 0.66°C, respectively. When Tw-A=10°C, ΔTp at 20 cm and 40 cm
was 1.42°C and 1.26°C, respectively.
Fig. 6. Relationship between plant temperature difference of irrigated-non-irrigated (ΔTp) and temperature difference of water-air (Tw-A).
20
cm:Δ Tp20 = -0.0051 Tw-A 2 + 0.1934 Tw-A R2 = 0.870**, n = 17
(4)
40
cm:Δ Tp40 = -0.0011 Tw-A 2 + 0.1368 Tw-A R2 = 0.950**, n = 17
(5)
Plant Temperature for Sterile Alteration of Rice
169
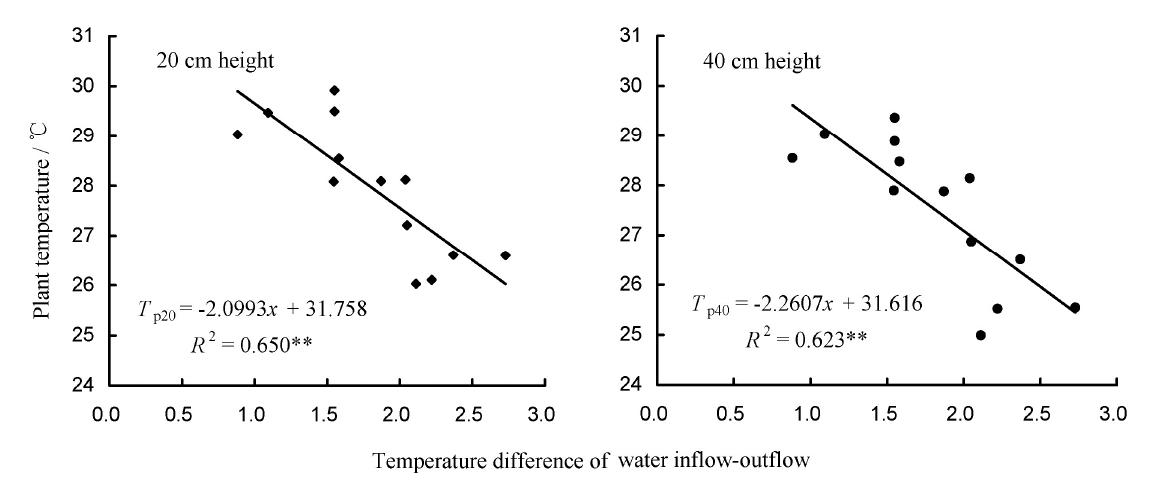
2.5.4 Effects of flowing speed of irrigated water on Tp
Flowing speed of irrigated water was also an important factor affecting Tp. The margin of Tw between inflow and outflow (50 m between them) denotes the flowing speed of irrigated
water. The equation of Tp established by margin of Tw between inflow and outflow of 13
days (with TA=17.4-22.5°C) showed that Tp was affected significantly by flowing speed of
irrigated water (Fig.7).
Fig. 7. Relationship between plant temperature and temperature difference of water inflow-outflow.
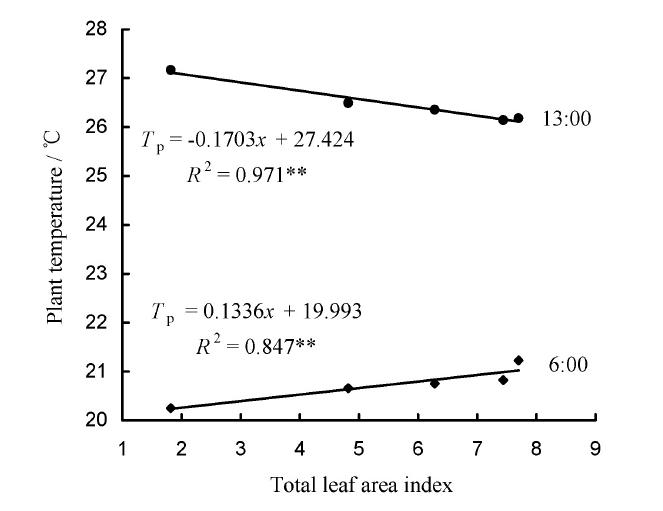
2.6 Effects of LAI of canopy on Tp
Rice layered LAI was decreased along with the increase of plant height. The relationship
between Tp at 06:00 and 13:00 and their corresponding LAI at 5 heights was shown in Fig. 8.
At 13:00, Tp was increased (actual value was increased from 26.9°C to 28.4°C) along with the decrease of the accumulated LAI. At 06:00, Tp was decreased (actual value was decreased
from 20.6°C to 19.7°C) along with the decrease of the accumulated LAI. It indicated that the canopy absorbed solar radiation at daytime and released the heat energy during night,
which regulated Tp.
Fig. 8. Relationship between plant temperature (Tp) and LAI ( x) at 06:00 and 13:00.
170
Agricultural Science
2.7 Simulation model of rice Tp by environmental factors
2.7.1 Analysis on correlations between Tp and environmental factors
Table 2 listed the correlations between Tp and weather or field environmental factors. It implied that Tp was regulated by various factors of canopy.
150 cm Inflow Outflow
Sunshine
Wind tempe- tempe-
Item Tp20 Tp40
Ta20
Ta40
T
hours
speed rature rature
A
(S)
(V)
(Tin)
(Tout)
Tp20 1
0.997** 0.985** 0.990**
-0.360** 0.944** 0.973** 0.981** 0.260*
Tp40
1
0.982** 0.995**
-0.366** 0.944** 0.971** 0.988** 0.270*
Ta20
1
0.973**
-0.392** 0.941** 0.971** 0.971** 0.320*
Ta40
1
-0.359** 0.950** 0.975** 0.994**
0.296*
150 cm
1 -0.330* -0.372** -0.390**
-0.200
Wind speed (V)
Inflow water
temperature
1
0.977** 0.943**
0.362**
(Tin)
Outflow water
temperature
1
0.967**
0.316*
(Tout)
TA
1
0.269*
Sunshine hours
1
(S)
* Sample no. 60, α0.05=0.259, α0.01=0.335.
Table 2. Correlations between plant temperature and weather or field environmental factors 2.7.2 Models of Tp at heights of 20 cm and 40 cm
Four indices were chosen to establish models for Tp at heights of 20 cm and 40 cm in the
present study: average temperature of inflow and outflow water [(Tin+Tout)/2],
temperature margin between inflow water and air at 150 cm (Tin-TA), wind speed at 150
cm (V), and sunshine hours (S). Results showed that both of two equations showed
significant high R2 (equations 6 and 7 and Fig. 9). Among the five parameters, Tin and Tout can be obtained by an actual measure, and TA, V and S can be obtained from local weather
station.
Plant Temperature for Sterile Alteration of Rice
171
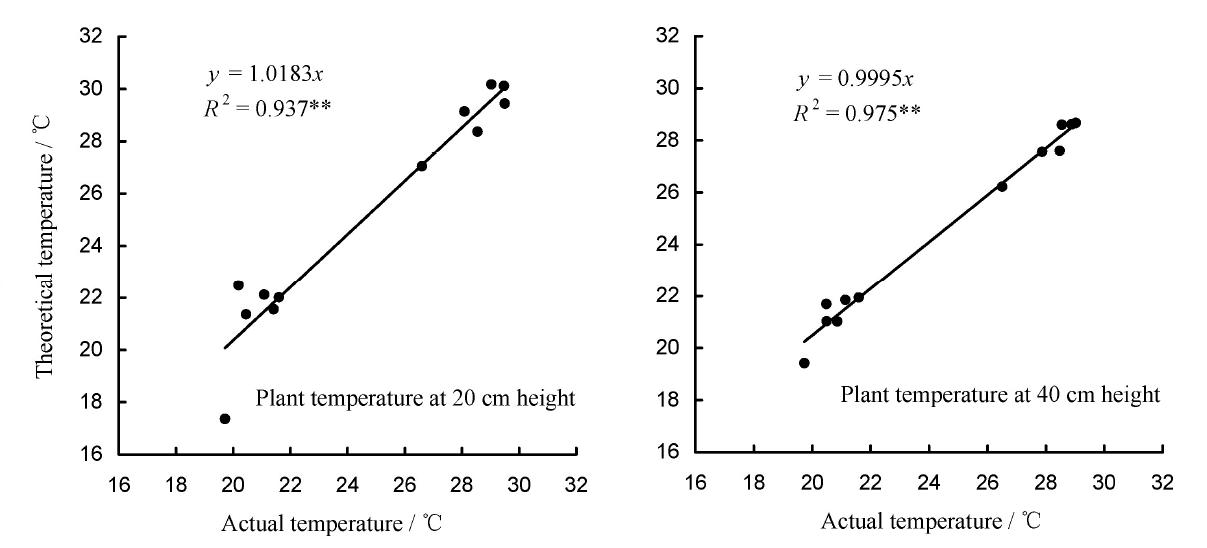
Fig. 9. Simulation effect of daily plant temperature at 20 cm and 40 cm heights.
Validation test showed that, the theoretical and practical values of Tp20 and Tp40 had
significant correlations, and the slopes of the linear equation were 1.0183 and 0.9995, close to 1 (Fig. 9). The relative error [(∑︱practical-theoretical︱/practical)/ n] of Tp20 and Tp40 were 3.93% and 2.95%, respectively.
Tp of 20 cm:
p
T 20 0.964( T T ) / 2 0.803( T T ) V 0.085(12 S) in
out
in
A
R2 = 0.993**, n = 61
(6)
Tp of 40 cm:
p
T 40 0.937( T T ) / 2 0.595( T T ) V 0.063(12 S) in
out
in
A
R2 =