Image Counting Difference
(%)
Manual
image
processing
1 139
142
2,11
2 36
34
-5,88
3 90,5
94
3,72
4 116,5
122
4,51
5 136,5
142
3,87
Table 2. Specifications of five experimental drying runs used for validation.
Within the image set, a high variability of ear’s number can be observed. With most of the images, high pass Fourier filtering method returns slightly higher counts. Based on the
whole image sample, absolute difference between manual counting and image processing
counting is contained under the value of 6%. The mean error obtained is 4,02% for this set of images.
The development of a high pass Fourier filtering approach method aims at creating an
easily usable and adaptable method while obtaining a best wheat ear detection. Therefore, it is essential to compare this approach with previously used methods such as hybrid
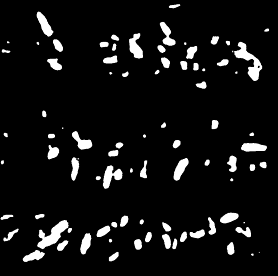
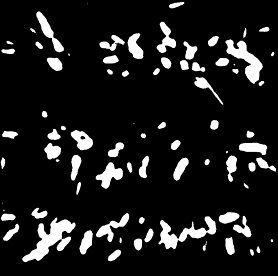
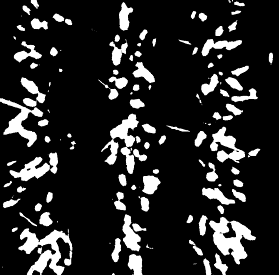
space method (Cointault et al., 2008b). For a visual comparison, high pass Fourier filtering has been applied onto images that have been previously treated with hybrid approach
(figure 13).

60
Agricultural Science
Fourier Hybrid
Fig. 13. Visual comparison between Fourier and Hybrid approach for two different images.
Visual comparisons with hybrid space results show that high pass Fourier filtering approach eliminate more non wheat objects within the images. Fourier approach separates more
efficiently ear groups. Calculation time for Fourier approach is few sec per image while its few minutes for hybrid space, with the same operating system.
High pass Fourier filtering gives global satisfying results. Although a close range of settings has been determined, inverse FFT remains a parameter that has to be adjusted according to input image. An empirical value has been found and gives good results for most of images
but it could be optimized with an automatic threshold selection such as k-means methods
(MacQueen, 1967).
In the context of wheat detection, it has been observed that some ear objects are eliminated after cleaning step. These non-detections mainly correspond to near ground ears or ears
massively hidden under leaves, hence, it should be relativized as too low ears may have
development problems and may not be considerate within wheat yield. Ears that are located in over or under exposed part of image are not well detected but it is not due to the
algorithm but to the quality of the acquisition, which is limited by the natural conditions.
Small amount of very big leaves also remain after cleaning step and eliminate these artifacts constitute a further axis of development, including shape analysis in cleaning step.
In the context of wheat ear counting, it is observed that counting error percentage decrease with number of ears in images, hence, best results may be obtained with images
representing more area and yet, more ears. Actually, worst error, 5,56%, is obtained with only 36 wheat ears in the image.
It is important to note that in most cases, Fourier approach returns slightly higher counts than manually counts. It should be due to missing detection, such as remaining leaves or
over exposed part of images. Counts should be more precise with the including of shape analysis in cleaning step. In all cases, whatever the method used, the only way to obtain a right detection is to use 3-Dimensional information.
Texture, Color and Frequential Proxy-Detection
Image Processing for Crop Characterization in a Context of Precision Agriculture
61
4. Proxy-detection image processing for weed-wheat crop discrimination by
hyperspectral imagery
In the domain of weed control, since the environmental and economical stakes are
particularly great, the herbicides are largely spread in order to assure sufficient yields for the whole field whatever the infestation rate.
The reason is essentially a technological one. Even if some low-cost devices are currently available to assure a localised spraying of herbicides on bare soil (vegetation detection by photoelectric cells), no commercial product allows a reliable and localised post-emergence treatment. Indeed, a such apparatus needs a sophisticated perception system, based on
digital vision and allowing to distinguish between weeds and crops. The identification of varieties inside the vegetation is nowadays the principal lock to the development of
localized weed control.
The corresponding research are numerous and can be divided into two main approaches
(Slaughter et al., 2008):
the spectral approach, in which the plant reflectance is the main parameter, using
hyper- or multispectral images (Feyaerts & Van Gool, 2001; Vrindts, 2002; De
Baerdemaeker et al., 2002). The difficulty is then to propose spectral differences
sufficiently robusts to lightning conditions
the spatial approach, based on spatial criteria such as plant morphology (Chi et al.,
2003; Manh et al., 2001), plant texture (Burks et al., 2000) … The main difficulty is tied here to the complexity and the natural variability of the scenes.
The study proposed in this chapter is tied to the previous approach: hyperspectral images of the wheat crop are acquired during the weed control period, and associated to specific pre-processing to avoid illumination conditions. After, the possible spectral discrimination
between wheat and dicotyledonous weeds by means of chimiometric tools has been evaluated.
4.1 Spectral pre-processing
The images acquired by the camera (after a first internal processing taking into account the spectral sensitivity of the sensor) are images of luminance, which by definition depend on both the reflectance of the scene and lighting conditions. This is why a reference surface (gray ceramic), for which the reflectance Rc was measured in the laboratory, was
systematically placed in each scene (figure 14). The average luminance Lc observed in the image to the reference can then be corrected reflectance for each pixel of vegetation :
Rf = Rc * (Lf/Lc)
(11)
where Lf is the observed luminance for that pixel.
It is important to note that the Rf value obtained is a "apparent" reflectance. Other phenomena are to be considered, namely:
The inclination of the observed leaf from the direction of the solar source, introducing a multiplicative factor of the light, and hence Rf
the possibility of specular reflection, adding a component to the spectrum colorless, and resulting in an additive constant of Rf.
62
Agricultural Science
These two phenomena are taken into account by applying a standard-centering
operation (SNV, or "standard normal variate") on each spectrum of the image (Vigneau et al., 2011).
4.2 Chemometric model
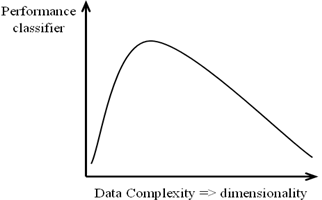
Because hyperspectral images include hundreds of contiguous spectral bands, they have a
very high potential for spectral discrimination, compared to classical colour or multispectral images. Unfortunately, in a classification context, these kinds of high-dimensional datasets are difficult to handle and tend to suffer from the problem of the “curse of dimensionality”, well known as “Hughes phenomenon” (Hughes, 1968) which causes inaccurate
classification (figure 14).
Fig. 14. Illustration of Hughes phenomenon
In this context, it is important to note that some news techniques already exist to
overcome this problem. Among all possible methods, many recent works have focused on
the area of dimensionnality reduction approaches in order to reduce this high-
dimensional datasets while maintaining the relevance of the information contained in the
signal.(Journaux et al., 2008). One of these approaches is the Partial Least Square
Regression (PLS-R) , which builds a low-dimension subspace by determining a set of
spectral “latent variables”. Compared to other reduction methods such as Principal
Component Analysis (PCA), the PLS takes into account both inputs and outputs to build
its subspace, leading to better performances. The PLS-DA (PLS Discriminant Analysis) is
an adaptation of PLS-R to discrimination problems.
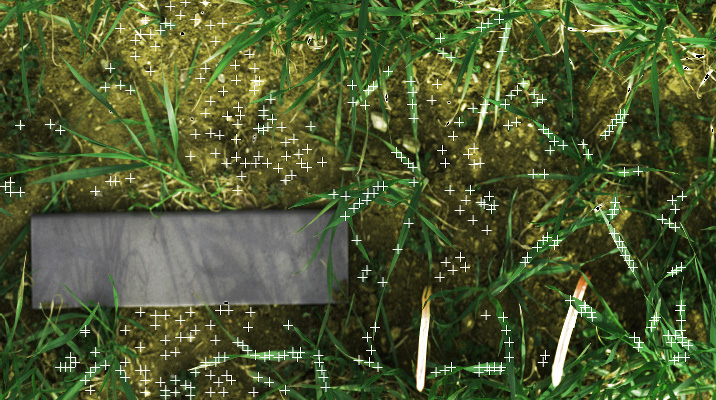
In our case, a total of 335 spectra was increased step by step on a first reflectance image (figure 15) in three categories, namely wheat (157 spectra), dicotyledons (60 spectra) and ground (118 spectra).
A PLS-DA model was then determined on this data set by cross-validation using
commercial software in chemometrics (The Unscrambler v9.7, CAMO Software AS, Oslo,
Norway).
The resulting discriminant model, which involves 8 latent variables, was then exported and applied to all pixels in an image test, using a dedicated software developed in C + +.


Texture, Color and Frequential Proxy-Detection
Image Processing for Crop Characterization in a Context of Precision Agriculture
63
Fig. 15. Calibration image and sample positions (the reference ceramic can be seen on the left)
4.3 Results
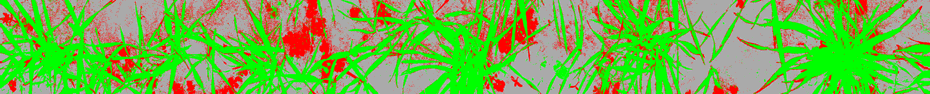
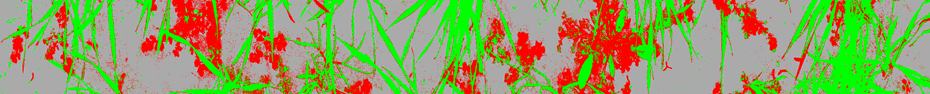
Figure 16 shows the image test and the classification results. We observe an excellent
discrimination between wheat and weeds whatever the local conditions of illumination
(shadow), with the exception of one type of weed (red circle) which was not present in the calibration image, and was therefore not included in the model.
Fig. 16. Test image and classification results (light gray: ground, red: weed, green: wheat) These results show the very high potential of hyperspectral image processing to extract
pertinent information for agronomic applications.
5. Proxy-detection image processing for seed development and germination
performance of chicory achenes by chlorophyll fluorescence
Several aspects of seed quality are tested routinely to minimize the risk of sowing seedlots that do not have the capacity to produce the desired crop. Amongst these tests, seed
germination is important since it represents the percentage of pure seeds that have the
potential to produce established seedlings in the field. The rate of germination corresponds to the reciprocal of the time needed for a given germination percentage to be reached
(Halmer, 2008). Accurate procedure of germination tests performed in laboratory is defined by the International Seed Testing Association (ISTA).
64
Agricultural Science
Besides these laboratory tests, seed processing lines includes cleaning machines that
remove dust and waste material, and conditioning machines performing dimensional
sizing, density sorting, and colour sorting. In conventional colour sorting, discoloured
seeds are rejected, on basis of inspecting seeds individually to detect differences in
reflected colour.
However, even after several sorting operations, some seed batches can contain a large
proportion of viable seeds but still not sufficient for commercial use. These batches are lost because the viable and non-viable seeds cannot be separated using the conventional
processing methods. The proportion of immature seeds in these lost batches is unknown. It would therefore be useful to provide a new, non-destructive method of distinguishing
immature seeds from mature seeds in order to improve sorting processes.
In this context, the potential of fluorescence imaging (Chen et al., 2002; Nedbal &
Whitmarsh, 2004) has been examined. The chlorophyll degrades during fruit ripening and
the process of degradation was described by Barry (2009). The chlorophyll is also a highly fluorescent molecule. Fluorescence occurs when some of the light absorbed by the
chlorophylls is re-emitted at longer wavelength, typically between 650 and 750 nm. The
fluorescent properties of chlorophylls have been used to evaluate the maturity of cabbage seeds ( Brassica oleracea L.) (Jalink et al., 1998; Jalink et al., 1999). The results showed that the magnitude of the chlorophyll fluorescence (CF) signal was inversely related to the quality of seeds. The relationship between the CF and germination performance was studied for
tomato ( Solanum lycopersicum L.) by Jalink et al. (1999) as in their previous study (Jalink et al., 1998). They concluded that seeds with an intermediate CF level were of the best quality, followed by seeds having a low CF signal. Seeds having a high CF signal were the worst.
Konstantinova et al. (2002) measured the CF of barley grains ( Hordeum vulgare L.) with a SeedScan I Laser Sorter (Satake, Stafford, TX. USA), using the principle developed by Jalink et al. (1998) but including a laser light source instead of a LED. They concluded that sorting a barley seed lot into six subsamples varying in CF values resulted in an optimal quality for the subsamples with low and intermediate CF signals. Suhartanto (2002) thoroughly
described the relationships between the fruit CF, seeds CF and germination performance of tomato.
5.1 Image analysis
A specific image analysis code was developed with the GNU Octave language (Ooms &
Destain, 2011). After applying background correction (the fluorescence values were divided by the reflectance signal of paper and multiplied by 60), the images were segmented a