,
(4.
10)
n =
28 lg 28
where n – duration
R, MPa
of concrete
hardening, R –
28
concrete strength at
28 days.
28 days 1 year 2
4
6
11 years
Age
Fig. 4.6. Increasing of strength of concrete (R)
in wet (1) and dry (2) conditions
83


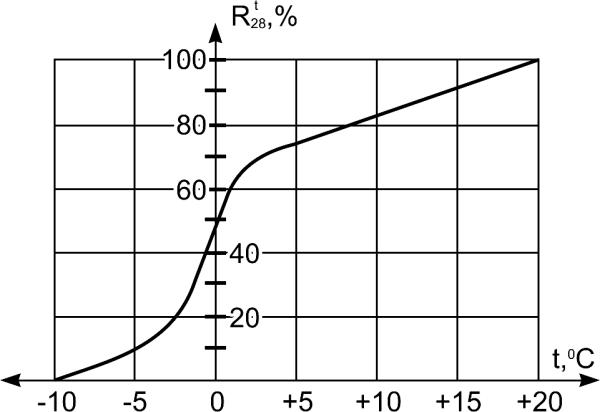
Compressive strength, % of 28-day
moist (normal) - cured concrete
Compressive strength, %
of 28 day concrete
Temperature of curing, 0C
Fig. 4.7. Increasing of strength of fresh concrete during 28
Age, days
days at temperature (t) from +20 to –100C
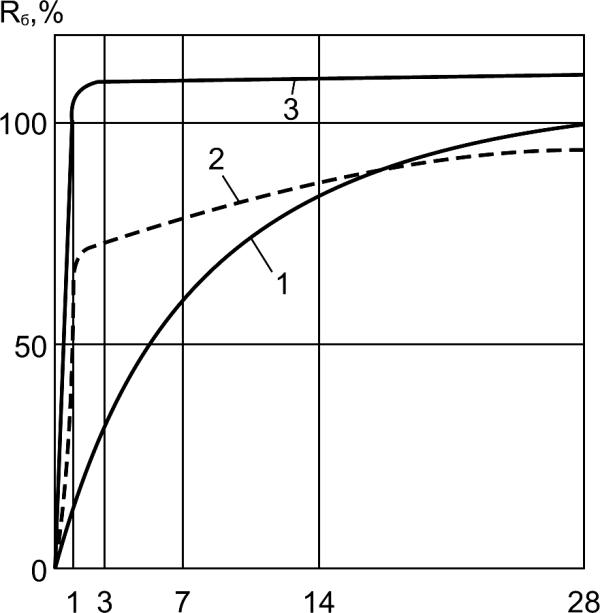
Fig. 4.8. Typical relationship between strength
and duration of curing for different conditions:
1-moist (normal) curing; 2-curing in live stream at
atmospheric pressure (800C max. steam temperature);
3-curing in high-pressure-steam autoclaves
84


4.5. Kinds of strength. Tests for concrete strength
The main kind of strength concrete is compressive strength that
correlates with tensile strength, shear strength, flexural strength
and other kinds of strength.
The values of concrete strength are greatly influenced by the
features of tester machines, conditions of test, and form of
specimens.
Various nondestructive tests (rebound, penetration, pullout,
vibration and other methods) are widely used in practice for
determination of strength of hardened concrete based on
relationship between strength and indirect evaluations.
For strength evaluation of hardened concrete by nondestructive
methods calibration charts are used, which related by measured
indirect evaluation to the compressive strength of concrete.
85


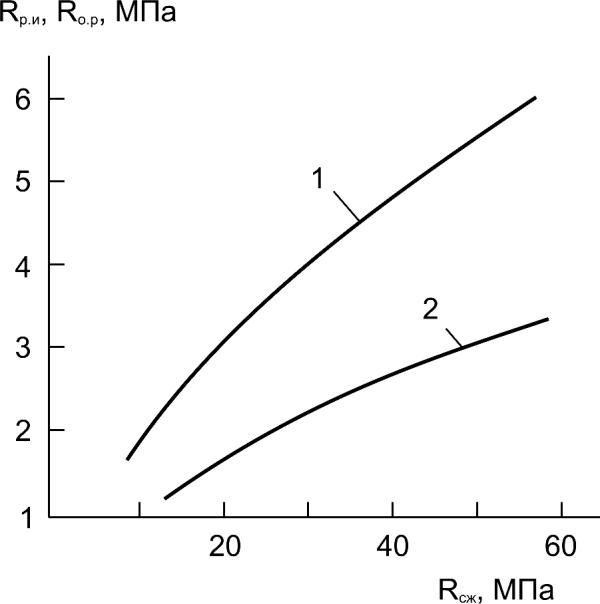
Rfl, Rtn, MPa
Rcmp, MPa
Fig. 4.9. Typical relationship between flexural
strength Rfl (curve 1), tensile strength Rtn (curve 2)
and compressive strength (Rcmp) of concrete
86