ACTIVITY RATIO ANALYSIS
To understand, if the company’s use of assets and process of running the operations are efficient or not, the activity ratio analysis is applied. Also referred as operation ratio analysis, or turnover ratio analysis, it includes calculating a set of indicators that allow making conclusions on how effectively the firm uses its inventories, accounts receivable and fixed assets.
Activity Ratio Calculation and Analysis
A ratio that measures the assets activity and firm’s ability to generate sales through its assets is total asset turnover. To compute it the net sales have to be divided by average total assets:
Total Asset Turnover = Net Sales ÷ Average Total Assets
It is obvious, that the higher this ratio, the better it is for a firm because this means it can generate more sales with some certain level of assets. Total asset turnover ratio can be compared with other similar-sized companies within the industry; the comparison with different industries businesses or noticeably smaller or greater firms wouldn’t be adequate.
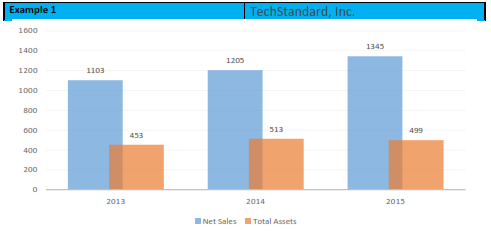
Chart 2. Financial data
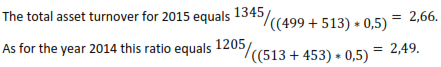
This means that the use of assets was more intense in 2015 comparing to 2014. TechStandard produced and sold 2,66 dollars of products for every dollar of assets in 2015.
Current Asset Turnover
A ratio that measures the assets activity and firm’s ability to generate sales through its assets is total asset turnover. To compute it the net sales have to be divided by average total assets:
Current Asset Turnover = Net Sales ÷ Average Current Assets
Bigger values for this ratios are preferable because this means the ability to generate more sales from some certain amount of current assets.
Working Capital Turnover (Sales to Working Capital)
The working capital turnover ratio, which is also being calculated while performing the liquidity analysis, has the following formula:
Sales to Working Capital = Sales ÷ Average Working Capital
This ratio measures the amount of cash needed to generate a certain level of sales.
Considering this, high working capital most likely indicates a working capital profitable use. In other words, sales should be adequate in relation to the working capital available. However, a comparison with other similar companies or industry average should be made before drawing any conclusions.
To measure how many times accounts receivable can be turned by a company into cash we should calculate the accounts receivable turnover ratio. This ratio indicating the liquidity of the accounts receivable can be computed as follows:
Accounts Receivable Turnover (Times) = Net Sales ÷ Average Net Receivables
The results of the calculations may be presented either in times per year, or in days. If measured in times per year the decreasing trend of this ratio would be negative for a company, meaning the ability to turn accounts receivable into cash has become lower.
However, when measured in days, the decreasing trend of this ratio is desirable, because it would mean fewer days are needed to turn the receivables into cash. The formula for the calculation of the accounts receivable in days is slightly different:
Accounts Receivable Turnover (Days) = Average Gross Receivables ÷ (Net Sales ÷ 360)
Often referred as average collection period, the accounts receivable turnover in days can also be computed as follows:
Average Collection Period (Accounts Receivable Turnover in Days) = 360 ÷ Accounts Receivable Turnover (Times)
Basically, this indicator is measuring the number of days between the date credit sale has been made and the day, when the money has been received from the buyer.
This is another ratio that can be used for performing the activity analysis of a firm. In opposition to accounts receivable turnover, this ratio measures the number of times per year a company pays its debt to suppliers (creditors). It can be calculated as follows:
Accounts Payable Turnover (Times) = Cost of Goods Sold ÷ Accounts Payable
Higher accounts payable turnover ratio indicates the ability of a firm to pay its debt to creditors frequently and regularly. The alternative formula for this ratio is as follows:
Accounts Payable Turnover = Purchases ÷ Average Accounts Payable
To measure the number of days that is averagely needed by a firm to pay the debt to its creditors, the days payable outstanding ratio is being computed. This can be done with use of the following formula:
Days Payable Outstanding = Accounts Payable ÷ Average Daily Cost of Sales
Generally, a low value of this ratio means efficient working capital usage. However, greater days payable outstanding ratio not necessarily indicates the bad position of a firm, because delaying payments to suppliers to the very last date can be made by a company regularly in order to shorten the cash converting cycle. Thus, the analysis should include reviewing the liquidity ratios too, because high days payable outstanding ratio and, at the same time, bad liquidity position of a company would indicate that it has problems paying its debt to creditors.
Inventory Turnover (Days Inventory Outstanding)
This ratio indicates how many days a firm usually needs to turn inventory into sales. The computation formula is as follows:
Inventory Turnover (Days Inventory Outstanding) = Cost of Goods Sold ÷ Average Inventory
Lower inventory turnover ratio would indicate that less time is needed for a company to turn the inventory to sales. Commonly, the decreasing trend of company’s inventory turnover indicates its working capital improvement.
A formula for the computation of this ratio measured in days is as follows:
Inventory Turnover in Days = Average Inventory ÷ Cost of Goods Sold ÷ 365
This formula calculates a certain number of days needed for the inventory of a firm to be converted to cash. There is also an alternative formula for this ratio:
Inventory Turnover in Days = 360 ÷ Inventory Turnover (Days Inventory Outstanding)
The efficiency of company’s usage of cash is indicated by the cash turnover ratio. It measures the amount of times that the firm’s cash has been spent through over some period of time. The formula for calculating this ratio is as follows:
Cash Turnover = Sales ÷ Average Cash and Cash Equivalents
Normally, a high value of this ratio is considered to be better, because this would mean that the company is using its cash effectively and turning it over more frequently. However, in some cases high value ratio can indicate that the firm has insufficient funds and may soon require short-term financing. An alternative formula for this ratio also includes marketable securities to the calculation:
Cash Turnover = Sales ÷ Average Cash and Cash Equivalents and Marketable Securities
Operating cycle is the number of days needed by a company to turn its inventories to cash. In other words, it is a period between the date goods are acquired and the date of cash realization from sales. Normally, the operating cycle of a business lasts less than a year, however, exceptions exist. Operating cycle computation formula is as follows:
Operating Cycle = Accounts Receivable Turnover in Days + Inventory Turnover in Days
Another measurement of company’s working capital use efficiency is the cash conversion cycle. It is defined as a number of days needed by a company for revenue generation from its assets. It is also often referred as net operating cycle and can be calculated with use of the following formula:
Cash Conversion Cycle = Inventory Conversion Period + Receivables Conversion Period - Payables Conversion Period
Divided into three stages, the calculation of the cash conversion cycle includes the following:
In conclusion it can be noted that activity ratio analysis is being applied for the measurement of the company’s working capital usage efficiency. Activity ratios indicate if a firm manages its inventories, cash, receivables and payables and other assets well.