PROFITABILITY RATIO ANALYSIS
Profitability means the ability of a company to earn a profit. Firm’s profitability is very important both for stockholders and creditors because revenue in the form of dividends is being derived from profits, as well as profits are one source of funds for covering debts. Profitability ratio analysis is a good way to measure company’s performance. Profitability ratios can be divided into two types: margins, indicating the firm’s ability to transform money from sales into profits, and returns, showing the ability of a company to measure the efficiency of the firm in generating returns for its shareholders.
Profitability Ratio Calculation and Analysis
Being a key ratio of profitability and one of the most closely followed numbers in finance, net profit margin (generally expressed as a percentage) measures net income generated by 1 dollar of sales. Calculate net profit margin as follows:
Net Profit Margin = Net Income Before Noncontrolling Interest, Equity Income and Nonrecurring Items ÷ Net Sales
The higher this ratio is, the better company performs in terms of profitability. Net profit margins will vary from firm to firm due to the different causes, such as, for example, competitive forces within an industry, economic conditions and operating characteristics. This ratio may also vary for different industries. An alternative formula for calculating net profit margin is following:
Net Profit Margin = Net earnings ÷ Net sales
Net profit margin can be used for the comparison of the same industry companies’ profitability and to compare a company's profitability to its past performance. Company’s net profit margin increase over some period means that it has become more effective at converting revenue into actual profit.
Another indicator of firm’s profitability is gross profit margin measuring the amount of its gross profit per 1 sales dollar. Both numerator and denominator for the computation of this ratio are available in company’s P&L statement:
Gross Profit Margin = Gross Profit ÷ Net Sales
The difference between this ratio and the net profit margin is that gross profit margin excludes costs of goods sold from the calculation. Although the ratio may vary between industries, higher ratios are preferable.
The operating income margin is a measure of operating income of an enterprise, generated by 1 dollar of sales. The numerator of this ratio is net sales excluding costs of goods sold and operating expenses (selling and administrative):
Operating Income Margin = (Net Sales – Costs of Goods Sold – Operating Expenses) ÷ Net Sales
Basically, the numerator defines the operating income of the company, so the following formula can also be used:
Operating Income Margin = Operating Income ÷ Net Sales
The higher this ratio is, the better. All the necessary information for the calculation can also be obtained from the income statement of an enterprise.
Return on assets is a ratio indicating how well company is able to utilize its assets. During the calculation the amount of profit is compared to the amount of assets, used for this profit generation:
Return on Assets = Net Income Before Noncontrolling Interest of Earnings and Nonrecurring Items ÷ Average Total Assets
Obviously, the higher ratios are preferable for a firm. The increasing trend of this ratio would show that the company’s asset use for the profit generation is reasonable, and it increases the amount of profit, generated by 1 dollar of its assets value.
This ratio includes only operating income and operating assets to the computation in order to focus on only revenue generating kind of assets. It can be calculated by the following formula:
Return on Operating Assets = Operating Income ÷ Average Operating Assets Operating assets exclude those kinds of assets that aren’t in direct use for the generation of revenue. The computation formula for the operation assets is as follows
Operating Assets = Total Assets - Construction in Progress – Identifiable Intangible Assets - Net - Goodwill - Deferred Income Taxes and Other Assets
The return on operating assets ratio may be used as an indicator of a firm’s effort of minimizing the assets, which are not taking part in the revenue generation process.
An important thing is to understand, how efficiently investments are used in terms of earning income. Return on investment (ROI) is a ratio that measures the income earned on investments and can be computed as follows:
Return on Investment = Net Income before Noncontrolling Interest and Nonrecurring Items + Interest Expense ÷ Average (Long-Term Liabilities + Equity)
This ratio is an important evaluating factor of company’s performance, since it reflects the ability of a business to provide the reward for its investors. High return on investment ratio also makes a firm attractive for potential investors, who might be interested in providing it long-term funds.
Another part of the profitability ratio analysis is return on equity ratio calculation, which measures the ability of a company to generate profits from the stockholders’ investments. The calculation formula for this ratio is as follows:
Return on Equity (ROE) = Net Income Before Noncontrolling Interest and Nonrecurring Items ÷ Total Equity
Having calculated the return on equity ratio one can see how much profit is generated by 1 dollar of shareholders’ equity. In other words, this is a measurement of how effectively money from stockholders is being used for the profits generation. Considering this, the value of the return on equity ratio is desirable to be high, because that would mean efficient usage of investors’ funds. One more formula for this ratio calculation is net profit after taxes being divided by the amount of stockholders’ equity:
Return on Equity (ROE) = Net Profit After Taxes ÷ Equity
DuPont analysis, named so after the DuPont Corporation, which was the first to use this formula in the 1920s, is the return on equity calculation broken into three parts. This was done to show that the return on assets depends on asset turnover and profit margin. Calculate DuPont return on assets as follows:
Net Income Before Noncontrolling Interest and Nonrecurring Items ÷ Average Total Assets = Net Income Before Noncontrolling Interest and Nonrecurring Items ÷ Net Sales × Net Sales ÷ Average Total Assets
Using this formula we can calculate firm’s return on assets for different periods of time. And if we see the decrease of this ratio, the conclusion can be made on the net profit margin and total asset turnover influence on it. Another more general formula for the DuPont return on assets calculation is following:
Return on Assets (ROA) = Net Income ÷ Sales × Sales ÷ Total Assets
DuPont analysis also includes calculation of return on equity ratio through return on assets ratio and financial leverage (also known as equity multiplier). See the following formula:
Return on Equity (ROE) = Net Income ÷ Total Assets × Total Assets ÷ Equity
Net income divided by total assets is the definition of return on assets, while total assets divided by equity is the financial leverage. From this formula we can see how closely related are two of the most important measures of the shareholders’ funds usage efficiency.
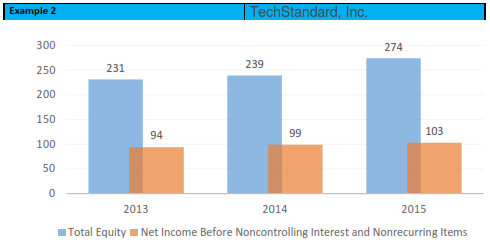
Chart 3. Financial data
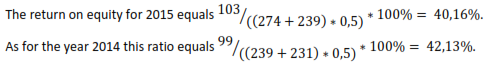
Every dollar of shareholders' equity brought 40,16 cents of the net income in 2015. A decline in 2015 comparing to 2014 was related to the growth of the total equity.
Summarizing everything, the purpose of the profitability ratio analysis is providing the information about the ability of business to generate profit. Firm’s profitability is the biggest concern for both its owners and investors, and it can be measured by calculated two groups of ratios: margins and returns. Return on assets and return on equity are two of the most important ratios for measuring the efficiency of usage of the stockholders’ costs. A complex of these ratios calculations is also known as DuPont analysis.