sensitivity obtained from the system with the unbalanced configuration was increased by 4
2.3 Results and Discussion of Complex OCT system
The performance of the complex conjugate ambiguity resolution in our 3x3 Mach-Zehnder
dB compared to the system with the balanced configuration. This is due to better utilization
SS-OCT system with the unbalanced configuration could be quantified by comparing the
of optical power with our unbalanced differential detection technique.
complex conjugate resolved A-scans with the unresolved A-scans. Measurements were
taken using a -55dB reflector including coupling loss in the sample arm as shown in Fig. 4.
The reference mirror was adjusted to a position such that the difference in optical path
length between the two interferometer arms was 500 m. The extra background noise was
subtracted by measuring the reference arm signals with the sample arm blocked.
0.1
-30
-30
-40
-40
-50
-50
0
-60
er (dB)
-60
er (dB)
27dB
-70
(b)
-70
(a)
-80
Pow
-80
Pow
Fig. 6. In vivo images of human finger tip acquired by our full range swept-source optical
Intensity (a.u.)
90o
-90
-90
-0.1
0 1 2 3 4 5 6 7 8
coherence tomography using the 3x3 Mach-Zehnder interferometer with unbalanced
0 1 2
1000
1100
3 4 5 6 7 8
Ph ase Pixel
differential detection technique. (a): the image was generated using only a single detector.
Depth (mm)
Depth (mm)
(b): the complex signals were used.
(a)
(b)
(c)
Fig. 5. The experimental results of the complex conjugate artifact resolution with our 3x3
Fig. 6 shows in vivo images of a human finger tip acquired by our full range swept-source
MZI SS-OCT in the unbalanced differential detection with 3x3 coupler ratio of
optical coherence tomography using the 3x3 Mach-Zehnder interferometer with unbalanced
0.39/0.29/0.32 in 500 m path length difference of the sample and reference arms. (a):
differential detection technique. The resolutions of the axial and lateral are 10 m and 27 m,
Measured interferometric signals of the output P
respectively. The pixel size of the images is 800x900 in correspond to the image size of
1 and P2 on two detectors with phase shift
of 90
3x4mm. In Fig. 6 (a), the image was generated using only a single detector, and
o. Inset: Measured full interferometric signals of the output P1 and P2. (b): A-scan signals
obtained by IFT from a single detector include the complex conjugate artifacts. (c): A-scan
demonstrates the folded artifact images. In Fig. 6 (b), the complex signal was used
signals obtained by IFT directly from the output signals at the two detectors with
demonstrating artifact-free imaging over a depth range of 3 mm.
suppressions of the complex conjugate peaks of 27 dB.
3. High Performance Wavelength-Swept Laser for Optical Coherence
Fig. 5 (a) shows measured waveforms of the output signal P1 and P2 from our unbalanced
Tomography
SS-OCT system with 3x3 port configuration as coupler ratio of 0.39/0.29/0.32, i.e., we
connected the lowest power port of the 3x3 coupler to the 2x2 coupler. The input power
3.1 Optical Filter Design for Swept Laser
ratios in this unbalanced setup were 2.8 and 2.4 for the two detectors, respectively. We
Fig. 7 shows a schematic diagram of the FDML wavelength swept laser with a long fiber
noticed from the full interferometric signals of the output P1 and P2 shown in the inset of the
ring cavity. A SOA is used as the gain medium in the ring cavity which has a central
Fig. 5 (a) that the DC values of the waveforms in the unbalanced system were removed by
wavelength of 1300 nm. The SOA is considered the most suitable gain medium for OCT
the high-pass filter of the detectors. Because a phase difference of 90o between the
applications: high small-signal gain, broadband gain spectra, and high relaxation resonance
interferometric signals P1 and P2 was obtained, the data of measured P1 and P2 was frequencies. The wavelength selection was achieved by a polygon-based high-speed
automatically become quadrature signals. Therefore, a minimized complex conjugate
narrowband optical scanning filter. The unidirectional wavelength sweep of a polygon
38
Biomedical Imaging
scanner, as opposed to the inherently bidirectional Fabry-Perot filter, is better matched to
and 40 mm, a polygon scanner with 72 facets and a facet area of 6.35x2.77 mm2 (Mao et al.,
the gain properties of an SOA. A mode-locked laser resonator was implemented using a
2009). A summary of the input parameters and simulation results are listed in Table 1. The
long single mode fiber (SMF). The polygon-based reflection-type scanning narrow-bandpass
observed 0.5 mm chromatic focal shift after F1 on both end of the spectrum wavelength ends
filter (Yun et al., 2003) includes an optical fiber collimator, an optical diffraction grating, an
were compensated for our double-pass arrangement. A change of the focal spot at the image
afocal telescope, a polygon scanner, and a planar mirror. A collimated Gaussian beam with
plane from circular to elliptical at the edge wavelengths, shown in Fig. 8, resulted in a nearly
a broad optical spectrum from the SOA was first spread by the optical grating and then
Gaussian output spectrum due to lower coupling efficiencies at those edges.
converged to the polygon by the telescope. The telescope, made of two achromatic doublets,
controls both the beam size and angles. A planar mirror was placed after the polygon to
reflect only the spectral component with normal incidence to the fiber. We note that the
Input Parameter
Value
Simulation Result
Value
sweeping angle of the intermediate reflection from the polygon facet doubles the polygon’s
Center
1305 nm
Collimate beam width (1/e2)
1.89 mm
effective rotation angle, so that the free spectral range (FSR) of this filter is twice than when
wavelength
the polygon simply retro-reflects the light back to the telescope. The orientation of the
Input fiber,
Single mode
Spectral sweeping range
± 55 nm
grating incidence angle and the rotation direction of the polygon facet determine the
core & NA
9 m & 0.11
direction of the wavelength tuning. The arrangement in Fig. 7 produced a unidirectional
Collimate lens
f = 10 mm
FWHM bandwidth at central
0.16 nm
increase of the wavelength that resulted in higher optical power output. An optical fiber
= 6mm
circulator was used to couple the light between the ring cavity and the filter. Three fiber
Grating density
830g/mm
Diverging angle after grating
-2.637o
polarization controllers were placed before the SOA, the circulator and the grating to
incidence angle
69 deg
at 1250 and 1360nm to central
+2.656o
optimize their polarization, respectively (Mao et al., 2009). The CW wavelength-swept light
Doublet 1
F1 = 75 mm
Converging angle at polygon
+4.944 o
was coupled out of the cavity by a fiber coupler positioned after the SOA.
= 25.4mm
at 1250 and 1360nm to central
-4.979o
Doublet 2
F2 = 40 mm
1/e2 Beam width at Polygon
2.78 mm
Laser Output
= 25.4mm
Polygon
facet
72
Chromatic focal shift after F1
0.50 mm
Polygon
Coupler
PC
number
at 1250 and 1360nm to central
0.51 mm
Doublet2
Polygon angle
5°
Image chromatic focal shift at
< 0.1 mm
per facet
1250 and 1360nm to central
< 0.1 mm
Mirror
Polygon radius
31.75 mm
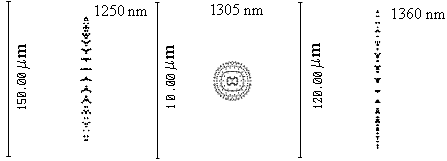
Image spot size at 1250,
120 x 10 m2
Circulator
SOA
1305, and 1360nm
2.6 x 2.6 m2
110 x 9 m2
Doublet1
Fiber Spool
Polygon
facet
6.35x2.77mm2
Coupling efficiency at 1250,
7%
PC
Grating
area
1305, and 1360nm
38%
8%
Table 1. The parameters of the polygon scanning filter obtained from ZEMAX simulation.
Fig. 7. Schematic diagram of a FDML wavelength-swept laser shown with a ZEMAX ray-
tracing of the polygon-based narrow-band filter.
1250nm
1305nm
1360nm
The parameters of the polygon scanning filter and its components were investigated by
using a commercial optical modeling software ZEMAX (ZEMAX Development Corp., WA,
m
m
m
USA). The ray-tracing layout of the optical filter is shown in Fig. 7 where a non-sequential
150
10
120
ZEMAX component was used to model the polygon scanner. As the polygon was rotated
clockwise by one facet, one full cycle of the continuous spectrum was swept. To achieve an
optical filter with a FWHM linewidth of 0.16 nm, central wavelength of 1305 nm, free
Fig. 8. Imaging spot size at 1250 nm (left), 1305 nm (central), and 1360 nm (right) of the filter
spectral range (FSR) of 110 nm, 100% duty cycle, minimum beam clipping and maximum
from ZEMAX simulation.
coupling efficiency, the following optical components were chosen: a fiber collimator with
10 mm focal length and 1/e2 beam width of 1.89 mm, a grating with a groove frequency of
The diffraction grating equation is given by (Hecht, 1979), λ = (sin + sin β)/ T, where λ is
830/mm and an incident angle of 69o, two achromatic doublets with focal lengths of 75 mm
the wavelength, T is the groove frequency, and and β are the incident and the diffracted
Full Range Swept-Source Optical Coherence
Tomography with Ultra Small Fiber Probes for Biomedical Imaging
39
scanner, as opposed to the inherently bidirectional Fabry-Perot filter, is better matched to
and 40 mm, a polygon scanner with 72 facets and a facet area of 6.35x2.77 mm2 (Mao et al.,
the gain properties of an SOA. A mode-locked laser resonator was implemented using a
2009). A summary of the input parameters and simulation results are listed in Table 1. The
long single mode fiber (SMF). The polygon-based reflection-type scanning narrow-bandpass
observed 0.5 mm chromatic focal shift after F1 on both end of the spectrum wavelength ends
filter (Yun et al., 2003) includes an optical fiber collimator, an optical diffraction grating, an
were compensated for our double-pass arrangement. A change of the focal spot at the image
afocal telescope, a polygon scanner, and a planar mirror. A collimated Gaussian beam with
plane from circular to elliptical at the edge wavelengths, shown in Fig. 8, resulted in a nearly
a broad optical spectrum from the SOA was first spread by the optical grating and then
Gaussian output spectrum due to lower coupling efficiencies at those edges.
converged to the polygon by the telescope. The telescope, made of two achromatic doublets,
controls both the beam size and angles. A planar mirror was placed after the polygon to
reflect only the spectral component with normal incidence to the fiber. We note that the
Input Parameter
Value
Simulation Result
Value
sweeping angle of the intermediate reflection from the polygon facet doubles the polygon’s
Center
1305 nm
Collimate beam width (1/e2)
1.89 mm
effective rotation angle, so that the free spectral range (FSR) of this filter is twice than when
wavelength
the polygon simply retro-reflects the light back to the telescope. The orientation of the
Input fiber,
Single mode
Spectral sweeping range
± 55 nm
grating incidence angle and the rotation direction of the polygon facet determine the
core & NA
9 m & 0.11
direction of the wavelength tuning. The arrangement in Fig. 7 produced a unidirectional
Collimate lens
f = 10 mm
FWHM bandwidth at central
0.16 nm
increase of the wavelength that resulted in higher optical power output. An optical fiber
= 6mm
circulator was used to couple the light between the ring cavity and the filter. Three fiber
Grating density
830g/mm
Diverging angle after grating
-2.637o
polarization controllers were placed before the SOA, the circulator and the grating to
incidence angle
69 deg
at 1250 and 1360nm to central
+2.656o
optimize their polarization, respectively (Mao et al., 2009). The CW wavelength-swept light
Doublet 1
F1 = 75 mm
Converging angle at polygon
+4.944 o
was coupled out of the cavity by a fiber coupler positioned after the SOA.
= 25.4mm
at 1250 and 1360nm to central
-4.979o
Doublet 2
F2 = 40 mm
1/e2 Beam width at Polygon
2.78 mm
Laser Output
= 25.4mm
Polygon
facet
72
Chromatic focal shift after F1
0.50 mm
Polygon
Coupler
PC
number
at 1250 and 1360nm to central
0.51 mm
Doublet2
Polygon angle
5°
Image chromatic focal shift at
< 0.1 mm
per facet
1250 and 1360nm to central
< 0.1 mm
Mirror
Polygon radius
31.75 mm
Image spot size at 1250,
120 x 10 m2
Circulator
SOA
1305, and 1360nm
2.6 x 2.6 m2
110 x 9 m2
Doublet1
Fiber Spool
Polygon
facet
6.35x2.77mm2
Coupling efficiency at 1250,
7%
PC
Grating
area
1305, and 1360nm
38%
8%
Table 1. The parameters of the polygon scanning filter obtained from ZEMAX simulation.
Fig. 7. Schematic diagram of a FDML wavelength-swept laser shown with a ZEMAX ray-
tracing of the polygon-based narrow-band filter.
1250nm
1305nm
1360nm
The parameters of the polygon scanning filter and its components were investigated by
using a commercial optical modeling software ZEMAX (ZEMAX Development Corp., WA,
m
m
m
USA). The ray-tracing layout of the optical filter is shown in Fig. 7 where a non-sequential
150
10
120
ZEMAX component was used to model the polygon scanner. As the polygon was rotated
clockwise by one facet, one full cycle of the continuous spectrum was swept. To achieve an
optical filter with a FWHM linewidth of 0.16 nm, central wavelength of 1305 nm, free
Fig. 8. Imaging spot size at 1250 nm (left), 1305 nm (central), and 1360 nm (right) of the filter
spectral range (FSR) of 110 nm, 100% duty cycle, minimum beam clipping and maximum
from ZEMAX simulation.
coupling efficiency, the following optical components were chosen: a fiber collimator with
10 mm focal length and 1/e2 beam width of 1.89 mm, a grating with a groove frequency of
The diffraction grating equation is given by (Hecht, 1979), λ = (sin + sin β)/ T, where λ is
830/mm and an incident angle of 69o, two achromatic doublets with focal lengths of 75 mm
the wavelength, T is the groove frequency, and and β are the incident and the diffracted
40
Biomedical Imaging
angles of the beam, respectively, with respect to the normal axis of the grating. The
simulated spectrum is the product of the filter spectrum (due to different filter coupling
sweeping wavelength ( dλ ) could be expressed as (Yun et al., 2003):
efficiencies at different wavelengths) and the spontaneous emission spectrum of the used
(9)
SOA. A full sweeping wavelength range of 113 nm and FWHM bandwidth of 90 nm at
d 1
( / T)cos0( F 2 / F 1)
d
central wavelength of 1303 nm measured from our swept laser were obtained. We note that
where d is the sweeping angle of the polygon scanner and 0 is the angle between the
the shape of the measured spectrum is close to a Gaussian distribution. This bandwidth of
optical axis of the telescope and the grating’s normal. Since d =2 Rdt for a polygon scanner,
the swept laser would correspond to 8.3 m axial resolution in the air in OCT. The measured
we could get a linear relationship between the sweeping wavelength and the sweeping time
sweeping FWHM bandwidth of the FDML swept laser was 1.43 times higher than the
by integrating Eq. (9):
simulated spectrum. This increase in bandwidth is due to higher optical gains in the smaller
4 cos
signal range at the edge wavelengths than the central wavelength. While keeping the
0 F 2 R
( t )
1
t
(10)
polygon static, two spectra were measured using the highest resolution of the OSA (0.01
TF 1
nm) at the center wavelength of 1303 nm and at the dual-edge wavelengths of 1248.0 nm
Our design results in a wavelength sweeping rate of 7.31 mm/s.
and 1358.2 nm, shown in Fig. 9 (b) in addition to the dynamic spectrum for comparison. A
distance of 110.2 nm between the two simultaneous existing peaks corresponds to the FSR of
the filter, which is in good agreement with the design specifications of FSR of 110 nm. We
3.2 Swept Laser Construction
also note that the static spectra of our FDML swept laser had a FWHM linewidth of 0.015
A Fourier-domain mode-lock wavelength-swept laser based on polygon scanning filter and
nm at the central wavelength as shown in the inset of the Fig. 9 (b). The measured filter
semiconductor optical amplifier was constructed. A high efficiency InP/InGaAsP quantum
linewidth was 0.17 nm at the same wavelength as shown in the Fig. 9 (c). We found the
well SOA (BOA 1132, Covega) was used as the laser gain medium with a saturation output
measured laser linewidth was 11.3 times smaller than that of the filter. The linewidth of
power of 19 dBm, small signal gain of 30 dB and FWHM bandwidth of 93 nm. The material
filter in the edge wavelength range increased which could be caused by the off-axis effect of
structure of the quantum well active region of the SOA was optimized to increase the output
the doublet; however, this effect was diminished by the FDML method as shown in Fig. (c).
power and bandwidth. A 72-facet polygon scanner (SA34, Lincoln Laser) that optimized for
Fig. 9 (d) shows average output power of the swept laser versus the injection current