4 Frameworks for understanding and describing business models
(Written by Christian Nielsen, Associate professor, PhD and Robin Roslender, Professor)
[Please quote this chapter as: Nielsen, C. & Roslender (2012), Frameworks for understanding and describing business models, in Nielsen, C. & M. Lund (Eds.) Business Models: Networking, Innovating and Globalizing, Vol. 1, No. 2. Copenhagen: BookBoon.com/Ventus Publishing Aps]
This chapter provides in a chronological fashion an introduction to six frameworks that one can apply to describing, understanding and also potential y innovating business models. These six frameworks have been chosen careful y as they represent six very different perspectives on business models and in this manner “complement” each other. There are a multitude of varying frameworks that could be chosen from and we urge the reader to search and trial these for themselves. The six chosen models (year of release in parenthesis) are:

• Service-Profit Chain (1994)
• Strategic Systems Auditing (1997)
• Strategy Maps (2001)
• Intellectual Capital Statements (2003)
• Chesbrough’s framework for Open Business Models (2006)
• Business Model Canvas (2008)
4.1 Service-profit chain
While the concept of the Service-Profit Chain is relatively unknown in the accounting, finance and innovation literature, it is more well-known in marketing management. This concept was first offered in 1994 and is heavily skewed towards a commercial reality in which the customer service of the company is assumed to portend the future for a growing number of businesses. Original y developed as a marketing management tool, the Service-Profit Chain observes that, in the “new economics of service”, senior management needs to focus on employees and customers rather than on profit goals and market share (Heskett et al. 1994). This logic is not dissimilar to that of Kaplan & Norton’s strategy maps (see section below) where the desired value manifests itself in high levels of profitability and increased market share is created by a workforce that is satisfied and loyal. Consequently, the positive attitude of employees is essential because these are the individuals who deliver the service to customers on a face-to-face basis. Even in the case of exemplary levels of service provision, a degree of customer turnover is unavoidable as individuals find their personal circumstances change, however, ways of minimizing such leakages become another strategic priority.
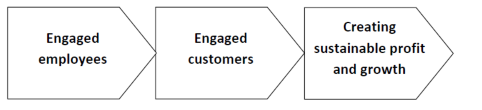
Figure 12: The Service-Profit Chain
The Service-Profit Chain is presented as a horizontal visualisation, with employee satisfaction identified using various attributes including: workplace design; job design; employee selection and development; employee rewards and recognition; and the provision of the necessary “tools for serving customers”. Implicit here is the requirement for all of these attributes to be embedded, reproduced and enhanced on a continuous basis. The immediate outcomes of high levels of employee satisfaction are then identified as employee loyalty and retention, both of which impact on a preparedness to strive for the highest levels of customer service provision. The latter are identified as the key to high levels of customer satisfaction and loyalty. Success in this regard is linked to high levels of customer retention, which Heskett et al. associate with zero customer defections (see Reichheld & Sasser Jr, 1990). Beyond simply retaining customers, opportunities for cultivating the advocacy of service offerings should constantly be explored.
Consequently, the Service-Profit Chain identifies a wide range of measurement metrics that may be used to report the performance of a business. As with the Strategy Map concept, a scoreboard is used to report company performance with a strong emphasis on employee and customer metrics and rather less on the actual business process. Conventional financial performance indicators also have a place within such a scoreboard approach but, as Heskett et al. observe, their importance is decentred. Thus, the approach provides the opportunity to combine sets of relevant lead (forward-looking) and lag (historical) indicators. Final y, the Service-Profit Chain uses narrative reporting to complement numbers and the focus on employees and customers, are best served by the use of more qualitative forms of reporting, which in turn complement the underlying strategy narrative.
In the Service-Profit Chain literature we find hints that the growing emphasis on businesses to produce year-on-year increases in shareholder value has had a negative impact on the evolution of the long-term evolution of the company. The Service-Profit Chain is in this sense a horizontal representation that begins with a market overview, which informs the business strategy. The business strategy translates into a range of value creating activities, including “customers” and “people”. The expectation is that, if appropriate sustainable relationships are maintained between the company and its customers and staff, long term financial performance will ensue.
4.2 The strategic systems auditing framework
Remembering that the business model is the platform which enables the strategic choices to become profitable, then it is clear that a business model is not a pricing strategy, a new distribution channel, an information technology, nor is it a quality control scheme in the production setup. A business model is concerned with the value proposition of the company, but it is not the value proposition alone as in itself it is supported by a number of parameters and characteristics. The question is here: how is
To understand the foundations of the business model, metaphorical y speaking, the pil ars on which the platform rests, it is necessary to look at the organizational attributes of the company. In doing so, the focus should not be on the elements themselves, i.e. organizational structure, alliances, management processes, customer types, but rather on the characteristics of the links between them. A few years after the Service-Profit Chain came out of the marketing management literature, the col aboration between KPMG and a group of financial reporting and auditing researchers and University of Illinois – Urbana Champagne, gave birth to the “Client Business Model” as it was called by KPMG. By the involved researchers it was denoted the Strategic Systems Auditing framework (henceforth the SSA framework).
Bell et al. define “The (client) business model as a strategic-systems decision frame that describes the interlinking activities carried out within a business entity, the external forces that bear upon the entity, and the business relationships with persons and other organizations outside of the entity” (1997, pp. 37-39). As such they identify six components which need to be described in order to encompass the description of a business model:
• External forces
• Markets
• Business processes
o Strategic management process
o Core business processes
o Resource management processes
• Alliances
• Core products and services
• Customers.
Bell et al. (1997) reason that gaining an understanding of key value creation processes and related competencies that enable the company to realize its strategy is an essential element of understanding its financial figures. By measuring and benchmarking the performance of core business processes and management and support processes, the ‘KPMG Business Measurement Process’, depicted in figure 13 below, facilitates and enhances an understanding of the risks that threaten attainment of the business objectives of the company. The following of this framework is argued to lead to an understanding of client business model and a documentation the ability of the company to create value and generate future cash flows, through depiction of the specific process analyses, key performance indicators, and business risk profile in the specific company, thus a similar procedure could potential y form the foundation for external communication more general y.
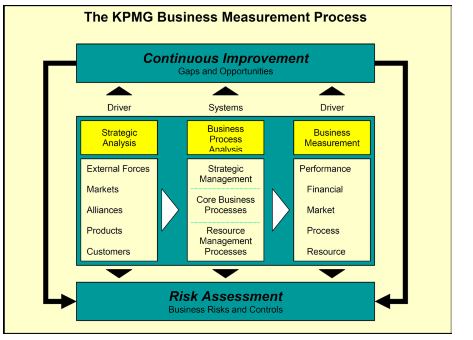
Figure 13: The KPMG Business Measurement Process (Bell et al. 1997)
The SSA model is as such based on an analysis procedure that departs in the strategic analysis of the external forces affecting the company, the markets on which it operates, along with an analysis of its alliances, products, and customers. Next, an analysis of the business processes regarding strategic management processes, core business processes, and resource management processes leads to a so– called Entity Level Business Model and the identification of key business performance measures. This is depicted in figure 14 below.
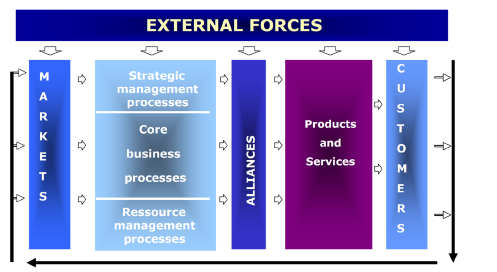
Figure 14: The Client business model (Bell et al. 1997)
Following up on the Strategic-Systems Auditing (SSA) model, Bell & Solomon define the business model as: “a simplified representation of the network of causes and effects that determine the extent to which the entity creates value and earns profits” (2002, xi). An interesting catch here is the distinction between value creation and profits, instigating that value creation should be perceived from a broader perspective than merely a shareholder value perspective.
Compared to the suggestions by Bell et al. (1997), the 2002 framework provided by Bell & Solomon focuses more narrowly on value creation and has predominately internal focus incorporating the elements of value drivers, value creation, and representation. As a distinctive feature, the SSA model departs from an auditing perspective where Bell et al. (1997) argue for the importance of gaining an understanding of the client’s strategic advantage. This is, however, not only a necessity from an auditing perspective since understanding the strategic advantage of a company is the prerequisite for understanding how it creates value.
Gaining an understanding of key value creation processes and related competencies that enable the company to realize its strategy is an essential element of such an analysis. By measuring and benchmarking the performance of core business, management and support processes, the ‘KPMG Business Measurement Process’, depicted in figure 13, facilitates and enhances an understanding of the risks that threaten the attainment of the business objectives in the company. The following of this framework is argued to lead to an understanding of the client’s business model and a documentation of the ability of the company to create value and generate future cash flows through depiction of the specific process analyses, key performance indicators, and business risk profile in the specific company. Thus, a similar procedure could potential y form the foundation for external communication more general y.
The SSA model is based on an analysis procedure that departs in the strategic analysis of the external forces affecting the company and the markets on which it operates, along with an analysis of its alliances, products, and customers. Next, an analysis of the business processes regarding strategic management processes, core business processes, and resource management processes leads to a so-called Entity Level Business Model and the identification of key business performance measures.

SSA gives an idea of the parameters that make up and define the outskirts of a business model. Through the strategic analysis, the following aspects of the organization are described: external forces, markets, alliances, products, and customers. Next, the SSA model includes a process analysis tool which helps the analyst from a risk based perspective to find the most appropriate KPI’s and controls of key risks for the company to be able to deliver the value proposition and through this identify the characteristics and key aspects of the links between organizational elements. The business process analysis is applied on three archetypes of processes, namely: strategic management processes, core business processes, and resource management processes. The process analysis follows the steps depicted below:
1. Process objectives
2. Inputs
3. Activities
4. Outputs
5. Systems
6. Classes of transactions
7. Risks which threaten objectives
8. Critical success factors
9. Other symptoms of poor performance
10. Performance improvement opportunities
Final y, the step of identifying Critical Success Factors leads to the actual business performance measurement including the identification of performance KPI’s according to the four dimensions: financial, market, process, and resource. This process is il ustrated in the box below for a Merger & Acquisition choice process.
4.3 Strategy maps
The Strategy Map (Kaplan & Norton, 2001; 2004) is a development of the Balanced Scorecard which original y emerged from management accounting practices in the mid 1980s (Kaplan and Norton, 1992, 1993; see also Maisel, 1992). Initial y, the Balanced Scorecard was described as a multi-perspective reporting framework; its principal function was to enhance internal management reporting, however, it was later considered to also have potential for external reporting. Kaplan & Norton (1992) identified four generic perspectives for the Balanced Scorecard: growth and development (later learning and growth); internal business processes; the customer; and financial perspectives. They later asserted that these four perspectives could be viewed as forming a cause and effect chain that was represented as a vertical configuration beginning with the learning and growth perspective Kaplan & Norton, 1996). As learning and growth is developed within a company, upward links are made to the internal (business process) perspective. Business processes are in turn linked to customers who, ultimately, influence the financial perspective of the company (Kaplan & Norton, 1996: 31). By 1996, the Balanced Scorecard was commended as a strategic management tool and, by 2001, it became clear that this cause and effect chain was intended to visualise a generic process for the creation and delivery of value to both customers and shareholders. In 2004, the Balanced Scorecard was described as “…one of the most influential management ideas of the past 15 years” (ICAEW, 2003: 23).
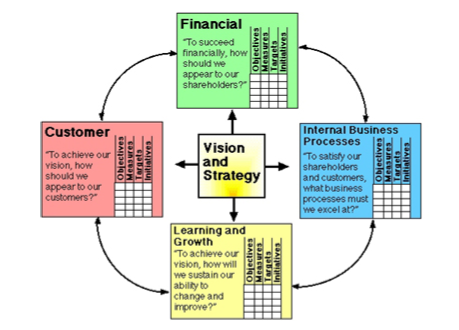
Figure 15: Balanced Scorecard anno 1996 (Kaplan & Norton 1996)
Kaplan & Norton (2001; 2004) use the Balanced Scorecard to develop the Strategy Map which they describe as the game plan of the enterprise and a tool to help management to accomplish long term goals and objectives of the company. Although financial objectives (such as return on capital employed) sit at the head of the Strategy Map, Kaplan and Norton recognise that the key to the success of an enterprise is customer loyalty which is developed through market offerings (value propositions). Kaplan and Norton maintain that, where customer loyalty is secured, financial targets are also likely to be achieved and ultimately shareholders will see their own value creation and delivery expectations fulfilled. In order to meet the expectations of the customer base, it is necessary for the enterprise to ensure that its various internal business processes are effectively configured and operated. Vital to this process is the appropriate utilisation of the resource base of the enterprise, with particular importance being placed on the creation and reproduction of a highly competent and committed workforce.
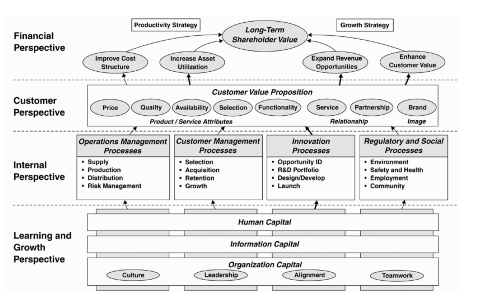
Figure 16: Strategy maps (Kaplan & Norton 2001)
According to Balanced Scorecard the basic theory for the economic company control is that it is based on the strategy of the company. As mentioned above, the financial budget constitutes the future plans of the company, translated into monetary units. If the company should move into a specific direction, such strategic views should be incorporated in the financial budget.
Similarly, if you want to influence actions carried out in the company with regard to implementing the plans of the company, you should also evaluate the steps which bring the company in the desired direction.
You will be able to find a number of other management models, which like the Balanced Scorecard are based on the outlined basic principles, such as: The Business Excellence Model, Total Quality Management, Business Model Analysis and Knowledge Statements.
4.3.1 Strategic understanding
The Balanced Scorecard is an example of how to manage your company by combining non-financial performance goals and financial performance goals. In the beginning of the nineties academic circles had a lively debate precisely on the sufficiency by managing on budget deviations alone. Popular phrases such as “If you can’t measure it, you can’t manage it” and “What gets measured gets done” were among the views which formed the basis for the debate. In his influential article from 1990 The Performance Measurement Manifesto Eccles argued in favour of companies being managed according to a more balanced set of details. By balanced details Eccles means both financial details and non-financial details, as well as details pointing forward and retrospective details.
The positioning perspective is the starting point for the Balanced Scorecard strategy understanding. The theory is that only a few key strategies, referred to as positions in the market place, are advisable in any given industry. The theory is that it is possible to defend the market position against existing and future competitors and that a unique position in the specific market place ensures the highest possible return. The strategic context is the market place which is characterized by finances and competition. The attractiveness of the particular market place is a decisive factor for the choice of position.
The strategic process forming the basis for the BSC theories is characterized by the fact that it is a deliberate process where a generic strategy is designed based on analytic calculation, and the purpose of which is to position the company in the market place. Thus the specific strategic process in connection with Balanced Scorecard passes four phases:
1. The management specifies the financial aims to be achieved, and the market segments to approach
2. The aims are to be achieved through customer satisfaction
3. Customer satisfaction is achieved through the “right” generic value chain model
4. To maintain the right generic value chain model in the future, goals for learning and growth must be defined.
The strategy contents are about choosing a position in the market. The process controlling persons are the top management having the role as designers of the value chain processes. A positioning approach is therefore a distinct outside-in view where the market conditions decide the strategy and thus the structure, the processes and the resources of the particular organization. The strategy which the management conveys to the organization is thus a report on the future profitability profile and market position of the company. The management is obliged to communicate the replies to the following questions to the rest of the organization: “Where is our future market position?” and “How can we compete?”
4.3.2 Managerial challenges
As described in the above sections the Balanced Scorecard is the strategic management tools to implement the strategy of the company, and the point of departure is that the performance level of the company is controlled by four different perspectives which are assumed to inter-relate in the shape of the causal relations. Therefore it is assumed that these four perspectives are based on the strategy of the company.
It is obvious to ask the following questions:
Do causal relations exist?
The chain of causal relations assumed to explain the connection between the competences of the employees, through the business model and the financial result of the company, the BSC model cal s a strategy map. However, the question is whether the asserted causal relation between the chosen key indicators and the financial results actual y exists in the real world?
Are the casual relations linear?
A correct identification of the correlations is vital for the identification of the correct actions. As an example, the correlations between an increased customer satisfaction and customer profitability are hardly linear. Undoubtedly it might be more profitable to use resources on changing a customer satisfied on the average into an extremely satisfied customer than using the resources on the customers who are already extremely satisfied. Thus the correlation is decreasing. Due to the underlying theory that BSC helps to create focus on the right performance measuring seen in relation to the perspective of the company, it would be obvious to ask as follows:

What happens to elements which are not measured?
“What gets measured gets done” is a widespread quote in the management discussions. This is obvious, also seen in the light that many companies connect rewarding systems to achieved results. However, if management focus points only in one direction it goes without saying that other elements will be given a low priority, which might have serious consequences. Therefore it is important constantly to consider whether the measured elements bring the company closer to the actual goal.
4.3.3 Strategy maps
The strategy map process is based on the overall goals and ideologies, and it aims at operationalizing the ambitious ideas and making them tangible, and thereby manageable. Therefore the process starts by looking at the vision and mission of the company to form the basis for the strategy map:
1. Define the vision of the company (what will we be/ achieve?)
2. Evaluate the mission of the company (why are we here?) and account for the core values (what do we believe in?)
3. Work out the strategy of the company (how can we fulfill the vision?)
In this way the company can describe, translate and implement the strategy by means of the strategy map in order to identify the measuring of the achievements related to value creation, financial result and management of the company by means of Balanced Scorecard. In the below subsection the strategy mapping is briefly described with regard to the four perspectives in Balanced Scorecard, i.e. the financial perspective, the customer perspective, the internal perspective and the learning and growth perspective.
Thus, the Strategy Map can provide a wide range of information on the implementation of a company’s chosen business model. Precisely how much information is provided depends on a number of factors; for example, only information that is relevant to understanding company performance should be reported. It is not intended that the Strategy Map supersedes the existing financial statements, instead it should provide supplementary information that helps stakeholders understand company performance more ful y. Likewise, the Strategy Map is not intended to reveal an enterprise’s most vital commercial secrets.
4.4 Intellectual capital statements
Intellectual capital reporting was developed to respond to criticisms of a mismatch between the market value of companies and their financial statements. While some contributors sought to put financial values on intangible assets, others pursued a scorecard/index-based approach to intellectual capital values, of which there are now several alternatives: The Skandia Navigator (Edvinsson, 1997), the Intangible Assets Monitor (Sveiby, 1997) and the Value Chain Scoreboard (Lev, 2001). All three of these reporting frameworks exhibit a number of similarities with the Balanced Scorecard and seek to provide a set of relevant indicators of intellectual capital growth using a combination of financial and non-financial information.
Danish researchers are credited with the initial (DATI, 1999, 2001; Mouritsen et al. 2003) and subsequent development (The Meritum Report 2002; Bukh and Johanson, 2003) of the Intellectual Capital Statement (ICS). More recently, principles for the production of ICSs have been proposed in Australia (Boedker, 2005). The main difference between the ICS and the scorecard approach to capital reporting is that the former is based in narrative rather than numerical indicators; advocates of the ICS commend the incorporation of a wide range of qualitative reporting, and often talk in terms of visualising intellectual capital rather reporting on it (Fincham and Roslender 2003). Equal y, there is always a place for relevant indicators, confirming the view that the ICS is underpinned by an extensive interpretation of what accounting entails (Mouritsen and Larsen 2005).
Its supporters argue that an ICS should communicate a narrative of knowledge resources in a company, the challenges that management face in the process of value creation, the initiatives identified by the company to do so and the resulting performance indicators (Mouritsen et al. 2003). The structure of this model is presented in figure 17 below.
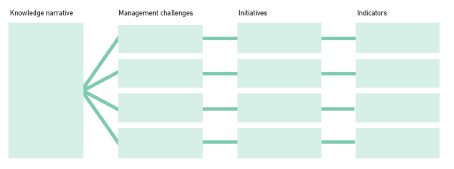
Figure 17: The Danish guideline for intellectual capital statements model (Mouritsen et al. 2003: 13)
The knowledge narrative is a story about how the company seeks to create value for its customers through the utilisation of its knowledge resources; it identifies the ambition of the company knowledge management and formulates a strategy for the company know-how in the future. Thus, the knowledge narrative has three elements: (i) how the customer is taken into account by the products or services of the company (the use value); (ii) which knowledge resources (for example, employees, customers, processes and technologies) it must possess to deliver the described use value; and (iii) the particular nature of the product or service in question.
To formulate the knowledge narrative, companies need to provide answers to a number of key questions including: what product or service the company provides; what makes a difference for the customer; what knowledge resources are necessary to be able to supply the product or service; and what is the relationship between value and knowledge resources? The company management challenges are informed by its knowledge narrative and relate to obstacles that the company must overcome to fulfil the ambition that has been set for it. This consideration is also informed by the answers to certain questions including: what are the challenges that the organisation is experiencing; which of the existing knowledge resources of the organization should be strengthened; and what new knowledge resources are required? Together, the knowledge narrative and management challenges contribute to a coherent strategy of knowledge management which results in the identification of a series of initiatives; for example, knowledge containers (such as employees, customers, processes or technologies). Management are required to choose and prioritise these initiatives.

Thus, although the first three elements of an ICS assume a narrative form, they can be supplemented by qualitative information where appropriate (such as il ustrations). In the final element, the results of the initiatives are monitored using quantitative indicators, as in scorecard approaches. As ever, the choice of indicators is informed by the information needs believed to be most relevant to users. Already, a number of key indicators have been identified including: staff turnover; job satisfaction; in-service training; turnover analysed by customer; customer satisfaction; precision of supply etc..
Barth et al. (2001) argue that traditional financial statements do not represent knowledge resources very well and consequently the Danish initiative was keen to promote ICS as an external reporting mechanism. The audit profession was also encouraged to provide a range of insights on how to make such a reporting framework more credible for external reporting purposes. Experiences from Danish firms issuing ICS (cf. Bukh et al. 2001; Mouritsen et al. 2001a, 2001b, 2001c, 2002) show that, intellectual capital is not only about knowledge resources in the form of human capital, customer capital, structural capital but also about their complementary attributes; for example, the productivity of one resource may improve by investments in another. It may be that investments in employee development will improve the effectiveness of IT technology, or customer-relations. If this is the case, human capital cannot be separated from organizational capital, or customer capital, and neither is there a causal relationship between them; the overall effectiveness is a collective effect that cannot be explained by the sum of its parts.
Hence, ICSs are not to be read simply by analyzing the indicators and imposing an explanatory model to link the elements in a causal relationship (Mouritsen et al. 2001c), instead, ICSs comprise of textual representations, pictures and other indicators about the knowledge management activities of the firm. Consequently, there is no specific ways of reading and interpreting IC reports and this makes the comparison of different IC reports very difficult.
4.5 Chesbroughs open business model framework
Chesbrough & Rosenbloom (2002, 5), define the business model as a