11 Analyzing business models
(Written by Christian Nielsen, Associate professor, PhD)
[Please quote this chapter as: Nielsen, C. (2012), Analyzing business models, in Nielsen, C. & M. Lund (Eds.) Business Models: Networking, Innovating and Globalizing, Vol. 1, No. 2. Copenhagen: BookBoon. com/Ventus Publishing Aps]
New types of disclosure and reporting are argued to be vital in order to convey a transparent picture of the true state of the company. However, they are unfortunately not without problems as these types of information are somewhat more complex than the information provided in the traditional financial statement. Plumlee (2003) finds for instance that such information imposes significant costs on even expert users such as analysts and fund managers and reduces their use of it. Analysts’ ability to incorporate complex information in their analyses is a decreasing function of its complexity, because the costs of processing and analyzing it exceed the benefits indicating bounded rationality. Hutton (2002) concludes that the analyst community’s inability to raise important questions on quality of management and the viability of its business model inevitably led to the Enron debacle.

There seems to be evidence of the fact that all types of corporate stakeholders from management to employees, owners, the media and politicians have grave difficulties in interpreting new forms of reporting.
One hypothesis could be that if managements’ own understanding of value creation is disclosed to the other stakeholders in a form that corresponds to the stakeholders understanding, then disclosure and interpretation of key performance indicators will also be facilitated.
If firms report key performance indicators singularly i.e. out of context, or similar information without disclosing the business model that explains the interconnectedness of the indicators and why the bundle of indicators is relevant for understanding precisely the strategy for value creation in the specific firm, this interpretation must be done by the analysts. Currently, there exists limited insight into how this interpretation is conducted.
Hägglund (2001), studied the conceptualization of investment objects, and found that capital market agents’ predictions of a company’s operations are made in three steps.
1. They create a detailed description of the present situation
2. Short horizons are applied in order to reduce risk in the predictions
3. They construct scenarios that make it possible to categorize new events as they happen
It is a general conclusion that an understanding of the value creation in a firm would be better facilitated if companies disclosed their value drivers as an integral part of strategy disclosure. Further, this communication would be even more effective if the framework for disclosure was based on a common understanding of the value drivers in the company. Several authors suggest that business models can enable the creation of a comprehensive and more correct set of non-financial value drivers of the company, thereby constituting a useful reference model for disclosure.
From an accounting point of view, improved disclosure is more or less about determining the types of information that most significantly explains market value, in order that these numbers can be disclosed and fed into the decision making process, maybe even capitalized, but at least used for benchmarking purposes.
It is, however, questionable whether this would improve anything. The analysts and professional investors already have deep insight into a lot of details, and the most important information is likely to be related to the specific strategies of the firms and hence difficult to compare and interpret unless it is disclosed as an integral part of a framework that explains how value is created.
Since understanding value configurations and customer value creation is more of interest from a strategy point of view, a possible reconciliation of the reporting-understanding gap could for the firm be to disclose its business model, i.e. the story that explains how the enterprise works, who the customer is, what the customer values – and based on this – how the firm is supposed to make money. Exactly how this disclosure should be reported is not easy to say, but it is one of the issues that will be addressed in later phases of this research project.
In the section above, it is evident that a business model potential y consists of the interaction between many different parameters of the organization. Some unique business models thus involve extremely complex interdependencies, whereas, in other cases, it can be extremely simple to understand the specifics of a business model. An example of a company where a complex set of interdependencies create a unique business model is the Danish medico-technology company, Coloplast.
For Coloplast the platform for a long-term sustainable business rests on the interaction between the ability to integrate the ideas and requests of the decision-making nurse-groups into product development without renouncing the product quality perceptions of end-users. Measuring the performance and development of these interdependencies is extremely complex. An example of a business model easy to understand is that of Ryanair: “a ticket includes no service whatsoever. If you require any extras or have physical handicaps, then remember your credit card”.

The notion put forth here is that if it is difficult for the company to conceptualize the business model, then it may be even more difficult for external parties to analyse and understand it. At present there exists basical y no literature on the aspects of analyzing business models. However, several management and performance measurement models can be mobilized to some extent in the understanding of business model performance. Below, four perspectives of analysis are identified, each with differing ambitions and therefore also with different theoretical underpinnings, namely: processes, causality, quality and competences.
It is widely accepted that intellectual capital, strategy and other drivers of value creation constitute strategical y important elements for the future profitability and survival of companies. Many firms already disclose much supplementary information in their management commentary regarding strategy, market competition, technological developments and products in the pipeline. Also, in the Nordic countries and more recently in a number of other European countries, companies have been experimenting with disclosing such voluntary and forward-looking disclosures through intellectual capital statements.
The problem – as well as the prospect – with strategy is that it is about being different. Hence, the bundle of indicators on strategy, intellectual capital etc. that will be relevant to disclose will differ among firms. For such information to make any sense at al , it should be communicated in the strategic context of the firm as this would show its relevance in relation to the value creation process in the company. In other words, it does not make sense to insert such information into a standardized accounting regime.
The SSA framework applies a risk-based perspective on value creation and combines the analysis of strategic and business related processes with risks and risk-controls to the identification of key performance indicators (KPI’s). Thus, the process analysis template of the SSA framework helps the analyst to conceive how the underlying aspects of performance are related to each other via a risk-based approach.
The Balanced Scorecard’s strategy map analysis is another methodology that helps to integrate KPI’s and il ustrates their interconnectedness. The Balanced Scorecard takes its point of departure in a cause-and– effect approach on competitive strategy. The strategy map methodology helps the analyst to link KPI’s through the four perspectives of the Balanced Scorecard. The Business Excellence model is a quality– based perspective to identifying KPI’s. Unlike the Balanced Scorecard, the Business Excellence model does not assume causal links, but rather a milder form of relatedness between measures.
In the section below, a fourth model for the analysis of performance measures is applied. It is a model developed for the analysis of the intellectual capital value proposition by Mouritsen et al. (2003). In its original presentation, the model was proposed to help create a set of rules for the analysis of intellectual capital statements that allowed the reader to appreciate the content of an intellectual statement in such a way that he or she could make an independent judgment of it. Later, it has been proven applicable to the analysis of many types of strategy-related disclosures, including voluntary CSR-reports, IPO prospectuses as well as the management review sections of traditional financial reports.
11.1 The analytical guideline
The idea of the analytical guideline was to develop analytical rules for voluntary information which paralleled the analytical concerns of the financial statement. According to Bukh et al. (2005) insight into financial assets could be translated to insight into the constel ation of knowledge and value creation resources; insight about investments could be translated into insight about upgrading competences and resources; and final y, insight into performance could be translated into insight about the effects of knowledge, innovation and strategic choices.
The information ‘input’ for the analytical model can be derived from the information channels of the company which is to be analyzed; e.g. from the annual report, corporate website, management interviews or reports of financial analysts. In the case where an annual report is the supplier of information, the input thus becomes the specific indicators representing value creation, management challenges and the activities that the company performs.
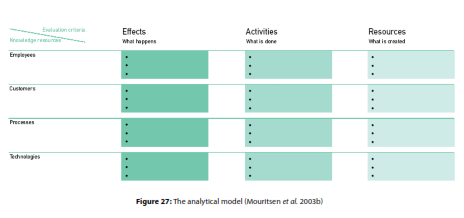
The indicators are disentangled from the text of the annual report through the analytical model that organises the indicators according to three general problematisations of the firm (similar to the problematisations of the financial statement): What is the composition of value creation resources (what is the composition of assets)? What are the activities made to upgrade competences and resources (which investments are made in the firm)? What are the effects of knowledge, innovation and strategic choices (what is profitability)? These questions are concerned with the assessment of the firm’s business model.
Unlike an accounting system, the analysis model is not an input/output-model. There is no perception that any causal links between actions exist to develop employees and the effect in that area – e.g. increased employee satisfaction. The effect of such an action may appear as a customer effect: The employee becomes more qualified and capable of serving the customers better. The task of the analysis is thus to explain these ‘many-to-many relations’ in the model. The classification itself does not explain the relations, just as increased expenses for R&D alone do not lead to increased turnover in the financial accounting system.

From Bukh et al. (2005) the assessment criteria of the analysis model based on indicators attached to the three main questions of the analysis are il ustrated:
Resource indicators concern the portfolio of the resources in the company, i.e. the stock and composition of the company resources within the areas of employees, customers, processes and technologies, and il ustrate a starting point from which action can be taken. The indicators deal with relatively stable units such as e.g. ‘a customer’, ‘an employee’, ‘a computer’, ‘a process’ etc. They answer questions such as ‘how many?’ and ‘which share?’ and thus il ustrate how big, how varied, how complex and how correlated the resources are. The managerial actions related to these resources are portfolio decisions; i.e. decisions on how many of the different types of knowledge resources the company wants.
Activity indicators describe the company activities to upgrade its resources; i.e. activities initiated to upgrade, strengthen or develop its resource portfolio. The indicators il ustrate the direction in which the organization is working and help to answer the question ‘What is being done?’; e.g. what does the company do to develop and improve its knowledge resources through e.g. continuing education, investments in processes, activities to educate or attract customers, presentations etc. The attached management actions are thus upgrading activities.
Effect indicators reflect the consequences or the total effects of the company development and use of resources. As with an accounting system, the model only shows the effects; it does not seek to explain from where they arise. The analyst may seek such explanations on the basis of the model, but not within the model itself. These indicators help us to establish whether we are arriving where we expected to.
Thus, when analyzing the interrelations of the business model it is possible to apply the ideas of a strategic narrative. Like all other stories, this narrative has a beginning, an action and an ending. So does the strategic narrative. It has resources, activities and effects. Together with an understanding of the company strategy and the key management challenges facing the executive management, it is possible to mobilize the questions of analysis il ustrated above to identify the key indicators of the business model. Evaluating the business model can therefore be done in a series of steps.
A first step could be to evaluate the identified indicators in a scorecard-like fashion in relation to a set of expected targets for each indicator. Thereafter the indicators can be evaluated in the analysis model by asking which indicators affect each other. This analysis can be completed by asking whether some of the 12 boxes have missing indicators. Together with the indicators at hand, management should ask themselves how they fit into the story of what the company does and how it is unique. In this manner, management is gradual y moving closer to its business model narrative supported by performance measures. In order to assess if the composition, structure and use of the company resources are appropriate, it is necessary to consider the development of the indicators over time, and final y the company may pursue relative and absolute measures for benchmarking across time and across competitors.
11.2 The process of evaluating business models
While evaluating the return on investment of a new machine, a new product line or entering a new market can be difficult enough, evaluating the potential return of investment in a new business model is even more complex. Problems of understanding, evaluating and valuing business models derive from:
• Lack of standardization, and thus comparability of the information
• Lack of time to analyze the information
• Lack of frames from which to analyze the information
• Lack of interest in these types of information
• Lack of correct form on which the information is conveyed
Plumlee (2003) finds that the complexity of information imposes sufficient costs even on expert users such as analysts and institutional investors, who, in turn, reduce their use of such information and this is of course problematic. The SC-investors do not real y understand information concerning business models, as it is not something taught in finance at business schools around the world (yet), or, perhaps it is because they cannot be bothered learning it for themselves. Whether these provocative assumptions are correct or not, time will tel . At least we can conclude that business models are not a part of business school curriculum and definitely not a part of the existing institutions of the financial markets!
Transparency, here understood as the goal of communicating about your business model is not necessarily a question of disclosing everything possible. Rather it is about creating an appropriate representation of the company value creation. This raises two key questions:
1. What is appropriate?
2. But what is a representation?
The logic of appropriateness as a basis for making decisions can be elucidated by the following question: “What would a person like me do in a similar situation?” Rather than calculating outcomes, a person is motivated by appropriate behavior, considering which rules apply to a specific situation. Thus a person makes decisions based on his/her identity, values and experience which form a set of rules-of-thumb.
Below we will describe the most important aspects associated with a behavioral perspective on decision– making based on the logic of appropriateness. In general there are two different perspectives of financial theory, prescriptive and descriptive. Prescriptive theories are equivalent to the normative view of financial markets, encompassing theories such as the efficient markets hypothesis etc. Descriptive perspectives include the behavioral approaches to finance theory, also known as behavioral finance.
In essence, the disagreements between these two paradigms of financial theory relate to the inevitable discussion of whether human rationality exists per se or whether our cognitive abilities imply that bounded rationality must be the point of departure for such theories. This discussion leads to an account of two different perspectives on human action, namely human action as being based on ‘logic of consequentiality’ and human action as being based on ’logic of appropriateness’. The behavioral approach to decision– making is concerned with, “explaining how decisions are made in terms of motives, cognitive processes and mental representations” (Ranyard et al. 1997, 3).
Representation is essential y modeling, as it concerns creating images of reality. Thus images of the outside world are projected to us through representation (via e.g. some sort of ‘technology’, i.e. a business model or other management technology). Latour (1999) argues that representation becomes reality as it is a construction of objectivity. From his point of view, interaction is the essence of existence. Through interaction, objects become real only when they are able to be circulated.
Latour argues that 3D objects cannot be circulated, only 2D objects can (Latour 1999). In this case representation abbreviates complexity. Mouritsen & Dechow (2001, 358) emphasize this type of reasoning in relation to e.g. competitive advantages and competences, stating that these become ‘facts’ only if their mobilization is successful, mobilization being facilitated precisely through representation.

Cooper (1992) il ustrates for us that representation is the transformation of the object – in our case the company – into a new form that produces control ability. Furthermore, influenced by Zuboff (1988), he argues for three underlying themes of representation; these constitute the mechanisms by which representation realizes this economy of mental and physical motion:
1. Remote control
2. Displacement
3. Abbreviation
Through remote control, symbols and other prosthetic devices substitute for direct involvement of the human body and its senses. Remote control thus underlines an economy of convenience by enabling control at a distance. The power of representation is the ability to control an event remotely, and can be described as a form of displacement in which representation is always a substitution for or re-presentation of the event, and never the event itself. The mobility of representation, created through displacement, is central to control (and thereby also to power).
Displacement emerges either as a transformation of the object, or as conceptual or material mobility, e.g. via projection. Displacement denotes mobile and non-localizable associations, while abbreviation makes possible the economy of convenience that underlies representation. Abbreviation, inducing a subset of the original object, is a principle of condensation, which enables ease and accuracy of perception and action. Through abbreviation, representations are made compact, versatile and permutable. Behind every act of representation lies the urge to minimize effort, i.e. the economy of convenience, also denoted as the principle of least effort (Zipf 1949).
When information is placed in the context of representation, it takes on a different meaning as representation is a more fundamental concept simply because information must first be represented in some way. MacKay (1969) supports this perspective in his definition of representation: “By representation is meant any structure (pattern, picture, and model) whether abstract or concrete, of which the features purport to symbolize or correspond in some sense with those of some other structure” (MacKay 1969, 161).
Information is that which contributes to the efficiency of a representation, thus providing advantage or gain. Representation and information are always preoccupied with the struggle for representational and informational gain (Cooper 1992) introducing the notion of decision makers, who change their representation of the problem in order to be able to reach a decision (Crozier & Ranyard 1997, 8). When perceiving business models as simplified versions of reality, representation becomes an abstraction of the business, identifying how that business makes money.
Let’s say that SC-investors do not understand information on business models, which may otherwise be regarded as highly value relevant. Therefore, although they want their decisions to look consequential, they are in fact characterized by the logic of appropriateness. Consequentiality is therefore often sought in some sort of quantification or scoring process, where the business model is evaluated and compared to other “business models” on an aggregated level.
One way to improve these methodologies is to contextualize information on the business model in a series of performance evaluation stories. Here one might think of representation as a story, made up of:
1. A beginning
2. Action
3. An ending
All three elements must be present for the story to make sense. This business model narrative then becomes an abbreviation supporting the ability of remote control, in essence constituting a representation of the business through a description; i.e. a story of how it works (Magretta 2002b) and the relationships it is engaged in. A business model can therefore be thought of as a comprehensive description of the business system, including how the experiences of creating and delivering value may evolve along with the changing needs and preferences of customers. Such a narrative is an explanation of how the organization intends to implement its value proposition.
According to Hol and (2009) the business model narrative, or strategic story, normal y connected many of the key elements in the value creation process. This was communicated external y to investors via a narrative connecting hierarchical, horizontal, and network value creation processes. Hol and writes that “Intangibles that were invisible to outside monitors were connected via the story to more visible intangibles and tangibles and to output and performance measures. Track record was then observed (made visible) by regular checks of the story against reality in the form of long-term corporate actions (increased R&D expenditure, new patents, innovation) and financial performance (earnings, EPS, cash flow, and actual growth in these), consistent with the value creation story.
The case companies argued that benchmarked intangibles set within the story were important sources of information. Some intangibles such as the effectiveness of R&D could be inferred from absolute (objective and visible) measures such as the absolute R&D spend, and by the number of observed innovations for this expenditure. These absolute numbers were ranked objectively, by case companies, analysts and Fms (fund managers), against competitors to get a comparative ranking. However, the contribution to value of many knowledge based competences or intangibles was difficult to measure. In these cases the key intangibles critical to a sector could be identified, and their effectiveness could be ranked on the basis of FMs or analysts subjective judgements, relative to competitors or the sector. Examples include the relative quality of top management, or the relative coherence of strategy. This relative, subjective benchmarking was the closest the case companies, analysts and FMs, came to formal or explicit ’measurement’ of many knowledge intensive competences or intangibles.
This leads us to some practical implications for companies who wish to engage SC-investors (or other investor types for that matter) in discussing and understanding their business models. Firstly, focus on understanding the connections and the interrelations in the business. The core of a Business Model description is the connections that create value, e.g. between the boxes by which we normal y structure the management discussion or the organization diagram. Remember that endless description of customer relations, employee competences, knowledge sharing, innovation and risks are more or less completely uninteresting to an investor. However, the real y interesting point is how these different elements interrelate, and which changes and fluctuations that are important to keep an eye on.
How is the chosen Business Model performing can be assessed by analyzing the status on operations, strategy and the activities we initiated in order to have a unique value proposition are performing. Trustworthiness can be established through performance measures relating to the narrative. For instance, the business model narrative could be highlighted with non-financial performance measures.
Remember, that one thing is to state that the business model is based on applying customer feedback in the innovation process, but, it is something else, and more valuable to explain how this is done, i.e. which activities enable this, and what are the outcomes of these activities. Not to mention proving the success of the activities through a number of performance measures which:
1) Show how many resources the company is spending on the activity (il ustrates the management focus),
2) Illustrate the level of activity and whether the company is keeping its promises, and
3) Show to which extent the activity has an effect, e.g. on customer satisfaction, R&D output etc.
Final y, this also enables the company to follow up on previous statements made by management and as such the business model narrative introduces a greater and broader sense of accountability to the organization. This accountability can be further enhanced by using time-series data on the identified performance measures. This would enable the company to depict a story of connections and relations and the investor/analyst to likewise depict his/her own story and discuss its implications with management.
Below in figure 28, we use the analytical model to analyzing the business model story of a wind turbine manufacturer.
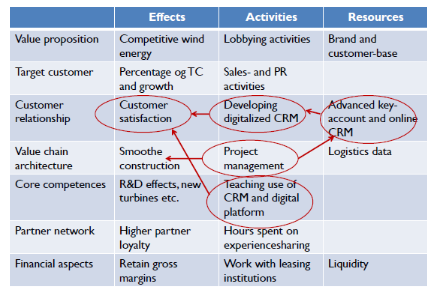
Figure 28 illustrates how the implementation of a CRM system in the wind turbine company leads to greater customer satisfaction. It also visualizes a series of key measurement points that could be applied in an early-warning system on how this strategic effort is coming along.
[The ideas put forth in this chapter are primarily based on Mouritsen et al. 2003b, Nielsen 2011a and Nielsen 2011b. For more information and consulting relating to analyzing strategic information such as CSR or ESG type information, contact XeQtive Management Advisory Services via www.xeqtive.com ]
Sum-up questions for chapter 11
• Why are analysts prone to not “getting” business models?
• Explain the differences between the three types of indicators
• Explain the steps by which the analytical guideline can be applied to analyzing a business model
• Explain how a business model becomes a representation
• Use the notion of a business model as story telling on an example of your own