How to use and apply Earned Value Management
Earned Value Management (EVM) Definition
Earned Value Management (EVM) helps project managers to measure project performance. It is a systematic project management process used to find variances in projects based on the comparison of worked performed and work planned. EVM is used on the cost and schedule control and can be very useful in project forecasting. The project baseline is an essential component of EVM and serves as a reference point for all EVM related activities. EVM provides quantitative data for project decision making.
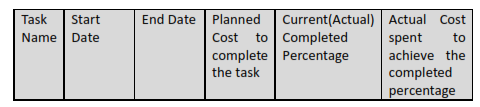
To use EVM you need to calculate three types of data:-
1. Planned Value (PV): the authorized budget for a planned piece of work. Sometimes called Budgeted Cost of Work Scheduled (BCWS).
2. Earned Value (EV): the authorized budget for work actually completed. Sometimes called Budgeted Cost of Work Performance (BCWP).
3. Actual Cost (AC): the costs actually incurred in completing the work actually achieved (the work as measured by the EV above) Sometimes called Actual Cost of Work Performed (ACWP).
To illustrate how to calculate above data on real example, consider below tasks:-
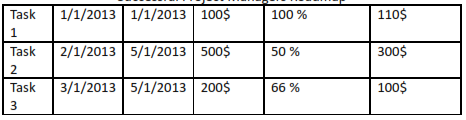
Consider that today is End of 4/1/2013, so we are expecting the 100% of
Task1, 75% of task 2 and 66% of task 3.
Now let us calculate each type of data
Planned Value (PV): 100 % of Task1 + 75 % of Task 2 + 66 % of task 3 = (1.0 * 100$) + (0.75 * 500$) + (0.66 * 200$) = 607$
Earned Value (EV): 100 % of Task 1+ 50 % of Task 2 + 66 % of task 3 = (1.0 * 100$) + (0.5 * 500$) + (0.66 * 200$) = 482$
Actual Cost (AC): Cost spent to achieve the completed percentage for each task = 110$ + 300$ + 100$ = 510$
Having above data only is not beneficial at all until it is used to represent the variances in the project which will tell you how much you are ahead or behind schedule and over or under budget.
To calculate how much your project has variance in schedule you need to calculate:-
Schedule Variance (SV): it is telling you how much in value your schedule is varied from planned value
SV = EV – PV = 482$ - 607$ = - 125$
If SV is positive value then it means you are ahead the schedule by this value, and vice versa if it negative value then it means you are behind schedule by this value in other words you need to compensate this value in your schedule to make SV = 1 which means your schedule is on track.
Schedule Performance Index (SPI): it acts like percentage or rate to describe how your schedule is behaving in terms of ahead or behind schedule.
SPI = EV / PV = 482 / 607 = 0.79
If SPI is greater than one then you are ahead the schedule and it is less than 1 then you are behind schedule.
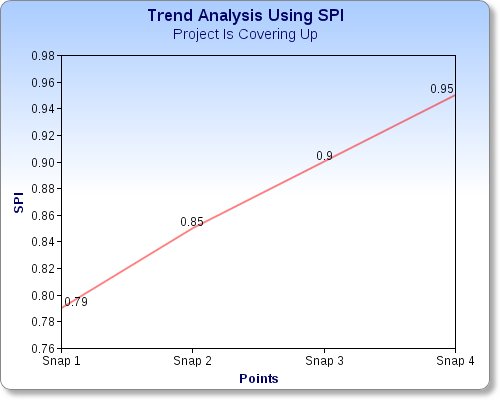
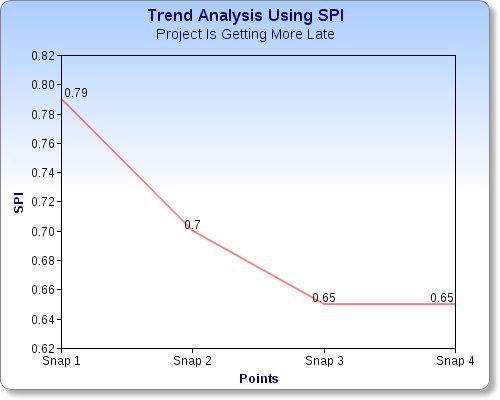
A great use for SPI is the “Trend Analysis” which depends on the calculated values of SPI at different points of time during the project like each month, so after 3- 4 months you can draw a graph which will tell you the trend in your project is either you are covering up and your SPI is going high to one or you are going more late and you SPI is going more below 1.0 for each month.
Using above calculation and figures you can know how your project is behaving and how it will continue, but schedule is not necessary reflecting cost meaning being behind schedule does not mean necessarily being over budget, so let us talk about cost analysis÷
Cost Variance (CV): it is telling how much more / less you spent on the achieved work.
CV = EV – AC = 482$ - 510$ = - 28$
If CV is positive then it means you save this amount of money and if it is negative so it means you spent this amount of money as extra to achieve this work in other words you are over budget by this amount of money.
Cost Performance Index (CPI): it acts like percentage or rate to describe how your cost/budget is behaving in terms of over or off budget.
CPI = EV / AC = 482/510 = 0.94
If CPI is greater than one then you are off budget and it is less than 1 then you are over Budget and you need to find a solution to compensate this unplanned extra money spent.
You can use the same idea of “Trend Analysis” to judge on your project trend in terms of cost control.
Notes (Place Your Notes Here)