Overall, respondents show relatively low levels of demand for credit, card-based, and savings products, as shown in Figure 12. The highest demand among customer-initiated products is that for POS credit (21 percent of respondents).
Generally, the intention to use financial products correlates with usage patterns. But in contrast to usage, there are no significant regional differences. The intention to use any of the financial products does not correlate with the type of settlement either. One slight difference to note is an extremely low interest in savings products in the North Caucasian FD.
Figure 12. Intention to use credit, card-based, and savings products
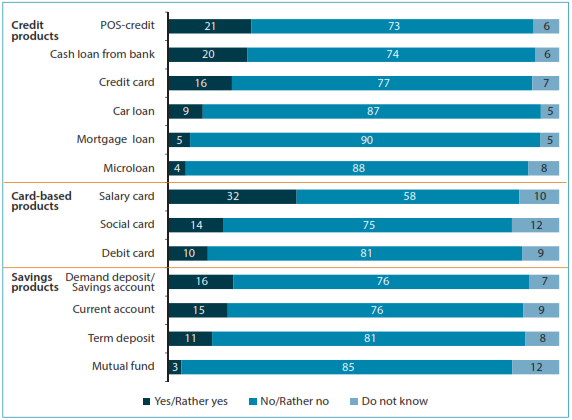
Note: Distribution of answers to the question “What is the likelihood that you (or your family) will apply for any of the following financial services in the next 12 months?” (percentage of total respondents, n = 2800).
In terms of income levels, lower-income groups show less interest in any of the savings products as compared to the average and the interest level of higher-income groups. Lower-income respondents also show lower than average intention to use credit, while in reality they still use it much more often than any of the savings products, as discussed earlier in this chapter.
This part of the research further confirmed that many respondents do not fully understand specific features of some financial products — which will be discussed in more detail in Chapter 3.
Detailed breakdowns of the survey results on the intention to use credit, card-based, and savings products are presented in Annex 3.
Insurance products
The intention to use insurance products is low for all types of products: the highest figure among voluntary products is 22 percent, for voluntary health insurance — which again may be due to the confusion of this product with the public medical care program (Figure 13). For most of the insurance products (with the exception of mandatory MTPL insurance), the share of those who do not intend to use these products ranges between 73 and 85 percent.
Figure 13. Intention to use insurance products
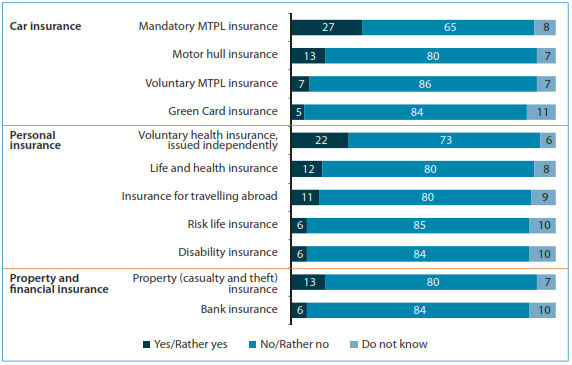
Note: Distribution of answers to the question “What is the likelihood that you (or your family) will apply for any of the following insurance services in the next 12 months?” (percentage of total respondents, n = 2800). Note that voluntary health insurance issued by employer was excluded as this type of insurance depends on employer decisions and cannot be requested by an employee (unlike salary cards, which can be requested).
The lowest intention to use insurance services was expressed by respondents in the North Caucasian FD. As discussed above, this is in spite of higher-than-average awareness about certain types of insurance in this region (e.g., risk life and disability).
The intention to use insurance services is lower for residents of rural areas and representatives of lower-income segments.
Detailed breakdowns of the survey results on the intention to use insurance products are presented in Annex 3.