Figures 15 and 16 summarize the top five reasons why respondents do not use credit products. The reasons diff er for longer-term and shorter-term products. With respect to the latter, microloans stand apart as trust comes high among the reasons not to use them, as well as little knowledge about microloans — consistent with the above findings about low trust in MFOs and low awareness about them.
Figure 15. Top five reasons for not using credit (except microloan)
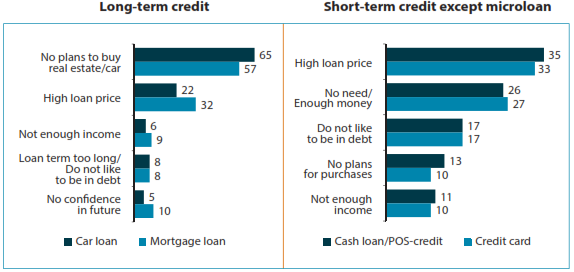
Note: Distribution of answers to the question “Why do not you plan to use credit in the next 12 months?” (percentage of total respondents who do not plan to use credit).
Interestingly, respondents in the higher-income categories tend to mention high loan prices for credit cards among reasons not to use them more often than people with lower incomes. This may have to do with the higher financial literacy levels of this segment.
Figure 16. Top five reasons for not using microloan
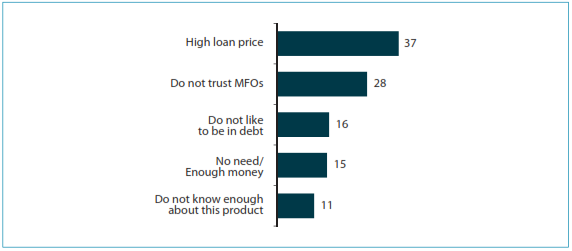
Note: Distribution of answers to the question “Why do not you plan to use microloan in the next 12 months?” (percentage of total respondents who do not plan to use microloan).
Card-based products
As shown in Figure 17, many respondents believe they do not need card-based products (including because they already have salary cards). This is also consistent with data on physical access infrastructure of POS terminals as discussed earlier — there are not many retail outlets accepting cards for payment.
Over a quarter of respondents mention that they do not know enough about card-based products (with respect to credit products, only microloans were not known to 11 percent of respondents).
Figure 17. Top five reasons for not using card-based products
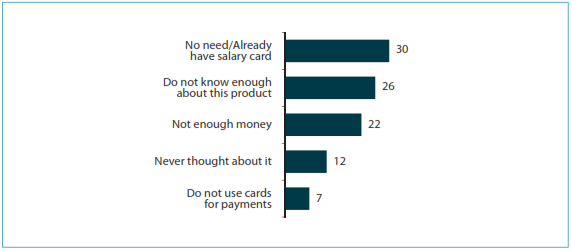
Note: Distribution of answers to the question “Why do not you plan to use card-based products in the next 12 months?” (percentage of total respondents who do not plan to use card-based products).
In terms of regions and types of settlement, respondents in the Northwestern FD and in its capital city St. Petersburg more often said they did not need card-based products because they already have salary cards (40 and 46 percent, respectively, versus 30 percent on average). This is consistent with usage patterns in this region and employment levels, and can also be due to active promotion of this product by regional banks.
Savings products
institutions — e.g., for large purchases — and smaller amounts should be kept at home (or are not worth saving at all).
Qualitative research also showed that mutual funds are considered to be very complicated products. Survey results confirm this by showing one-third of respondents saying they do not know enough about saving with mutual funds (which is also consistent with findings on awareness levels). In line with the findings on the trust in financial service providers, a higher percentage of people do not trust saving with mutual funds than saving with banks.
Figure 18. Top five reasons for not using savings products
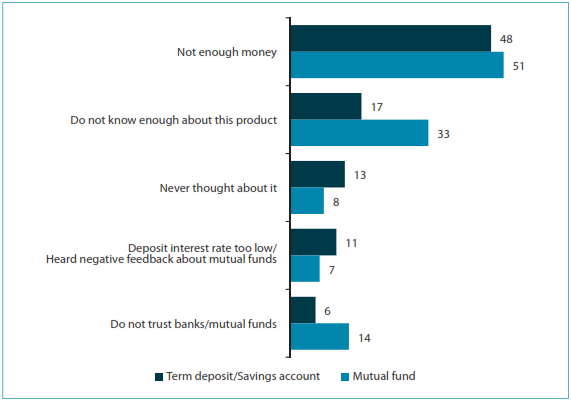
Note: Distribution of answers to the question “Why do not you plan to use savings products in the next 12 months?” (percentage of total respondents who do not plan to use savings products).
Insurance products
As customer responses on reasons for not using insurance products showed very similar patterns, they are presented in the aggregate by groups of insurance products — car insurance, personal insurance, and property/financial insurance. As shown in Figure 19, a vast majority of respondents believe that insurance products are not necessary; other reasons are much less significant.
Alternative instruments to insurance, in their view, are savings and “just in case” credit cards, as discussed above.
Figure 19. Top five reasons for not using insurance products
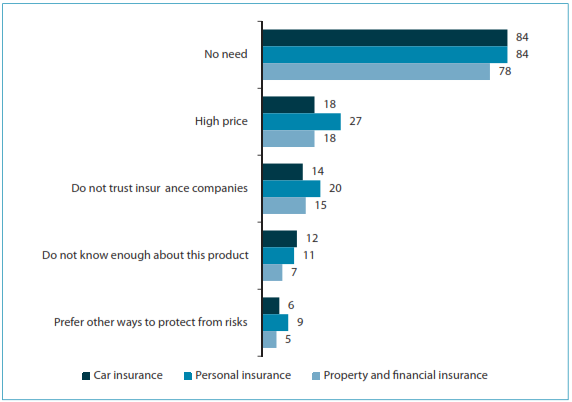
Note: Distribution of answers to the question “Why do not you plan to use insurance products in the next 12 months?” (percentage of total respondents who do not plan to use insurance products).
Delivery channels
Similar to insurance products, reasons for not using delivery channels are presented by the groups of channels — traditional, transitional and innovative (Figures 20, 21, and 22).
As can be seen, traditional channels are mostly viewed as inconvenient in terms of their location, except payment in cash to service providers directly (e.g., utility companies). At the same time, direct payment in cash to service providers is seen as the least trusted option among the traditional channels; this may be explained by findings of the qualitative research when some people mentioned that they preferred to pay via a third party to make sure that if something goes wrong, it would be taken care of (e.g., a bank will be responsible if a payment for utilities does not go through).
Figure 20. Top five reasons for not using traditional channels
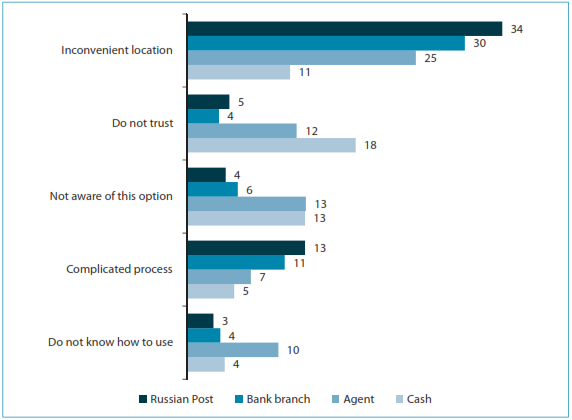
Note: Distribution of answers to the question “Why do not you plan to use the following channels in the next 12 months?” (percentage of total respondents who do not plan to use respective channels).
participants expressed their concern that a payment terminal or ATM may break when used for payments, and their money would be lost; while at a bank or a post office they can demand their money back if a payment does not go through. In addition, unlike for traditional channels, among the reasons for not using transitional channels is high price of services.
Figure 21. Top five reasons for not using transitional channels
Note: Distribution of answers to the question “Why do not you plan to use the following channels in the next 12 months?” (percentage of total respondents who do not plan to use respective channels).
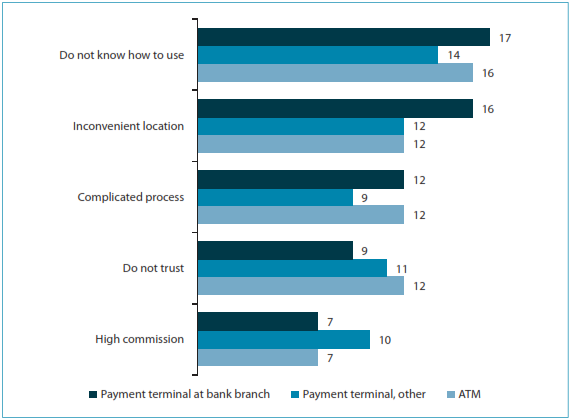
For the innovative channels, there are the highest percentages of those not knowing how to use them and not trusting them.
Figure 22. Top five reasons for not using innovative channels
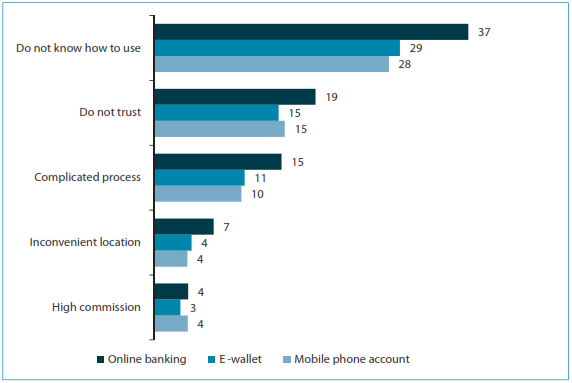
Note: Distribution of answers to the question “Why do not you plan to use the following channels in the next 12 months?” (percentage of total respondents who do not plan to use respective channels).
During the research, respondents were asked specifically about using the Internet and mobile phone for payments and other transactions. As shown in Figure 23, the responses are similar for both communication channels: people either do not feel they need these options or are not aware of them; close to one-quarter of the respondents do not trust these channels.
Figure 23. Top five reasons for not using the Internet/mobile phone for payments and other transactions
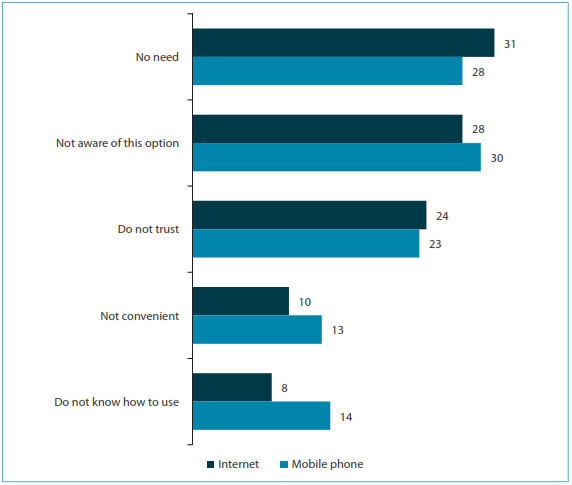
Note: Distribution of answers to the question “Why do not you make payments and other transactions via the Internet/mobile phone?” (percentage of total respondents who do not use the Internet/mobile phone for payments).
Detailed breakdowns of the survey results on the reasons for not using financial services and delivery channels are presented in Annex 3.