3.3 Reasons for using financial services
In addition to understanding people’s reasons for not using financial services, it is important to understand reasons for using them. This can provide more comprehensive information on people’s financial behavior and can potentially help in the design of financial inclusion programs and products.
Credit products
When analyzing statistics, it was clear that reasons to use credit products diff ered significantly for loans with monthly installments and credit card loans (Figure 24). The number one reason for using credit cards was “just in case” — similar to other card-based products as will be presented further. During the focus groups, some people mentioned that having a credit card is good for emergencies (e.g., medical treatment, car accident); in other words, they saw it like some sort of an insurance product. It should be noted that 32 percent of respondents could not cite a reason for using a credit card as it is often offered by a bank and is not actually requested by customers.
Respondents in Moscow and St. Petersburg more often mentioned not wanting to wait until they save enough — 30 percent and 26 percent versus 16 percent on average. Interestingly, in terms of income levels this reason was more often cited by both respondents with the highest and the lowest income levels — 28 percent and 23 percent, respectively.
Figure 24. Top five reasons for using credit products
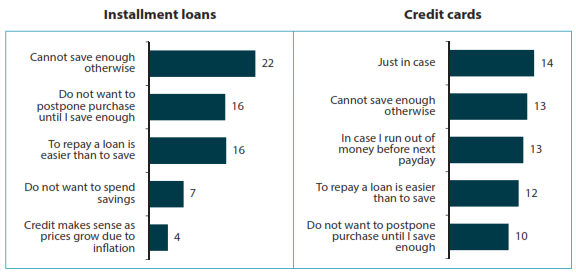
Note: Distribution of answers to the question “Why do you plan to use credit products?” (percentage of total respondents who plan to use credit).
Card-based products
Only about one-fifth of respondents consider card-based products as transaction instruments, while about the same number of people view them as “just in case” products. Some view them as a flexible savings product because a card allows for withdrawal at any time from an ATM without going to a bank branch (Figure 25).
In terms of regional differences, respondents in the Far Eastern FD view cards as payment instruments more often (30 percent versus 19 percent Russia-wide). This is consistent with the finding on the higher usage of card-based products and transitional and innovative channels in this region. In the North Caucasian FD, people more often decide to use card-based products “just in case” (25 percent versus 20 percent).
Respondents with higher income levels tend to use card-based products as payment instruments more often than lower-income segments (29 percent).
Figure 25. Top five reasons for using card-based products
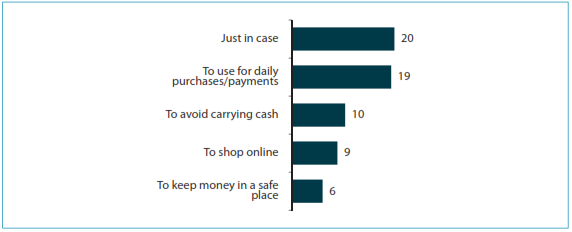
Note: Distribution of answers to the question “Why do you plan to use card-based products?” (percentage of total respondents who plan to use card-based products).
Savings products
The main reasons to use savings, in the view of respondents, are either to ensure the safety of their money or to save for a big purchase or special occasion. To a much lesser extent savings products are viewed as income-earning instruments (Figure 26).
Saving for a big purchase is more often mentioned in the Far Eastern FD (27 percent versus 16 percent, on average); in the Southern FD, a higher percentage of respondents mentioned the safety of money as the reason — 37 percent versus 20 percent Russia-wide.
In terms of income levels, higher-income segments tend to use savings products for saving for a big purchase more often than lower-income segments.
Figure 26. Top five reasons for using savings products
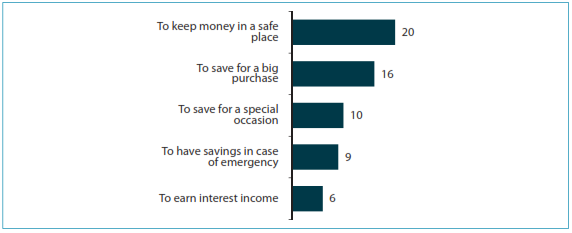
Note: Distribution of answers to the question “Why do you plan to use savings products?” (percentage of total respondents who plan to use savings products).
Insurance products
Not surprisingly, the number one reason to use car insurance is a legal requirement to have mandatory MTPL insurance for all car owners (Figure 27). At the same time, when looking at disaggregated figures, 19 percent of people mentioned that car insurance is mandatory with respect to voluntary MTPL insurance as well. Similarly, 32 percent of respondents mentioned voluntary health insurance as being mandatory (confusing it with the free public medical care program discussed earlier).
For personal insurance, the desire to get compensation in case of an accident or to feel protected is more typical for people 35–44 years old, as well as for older respondents (60+). The latter age group also tends to plan using property insurance more often.
Figure 27. Top five reasons for using insurance products
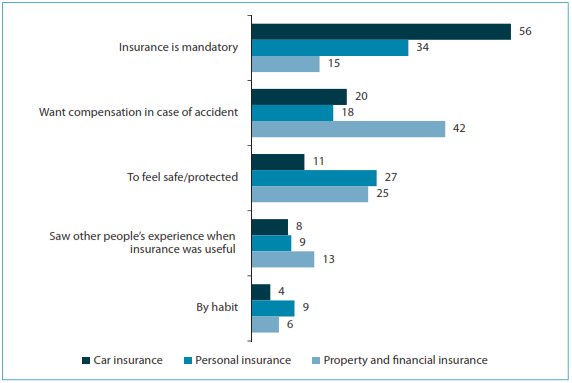
Note: Distribution of answers to the question “Why do you plan to use insurance products?” (percentage of total respondents who plan to use insurance products).
Delivery channels
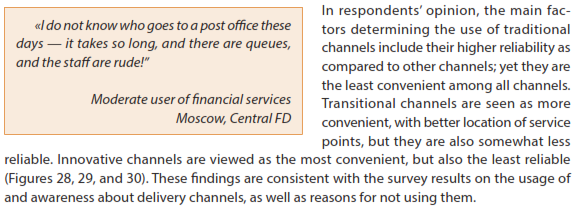
Overall, the attitudes to delivery channels are generally uniform across all sociodemographic segments. Respondents of the older age tend to consider both transitional and innovative channels even less reliable that younger Russians.
Figure 28. Top five reasons for using traditional channels
Note: Distribution of answers to the question “Why do you plan to use the following delivery channels?” (percentage of total respondents who plan to use respective delivery channels).
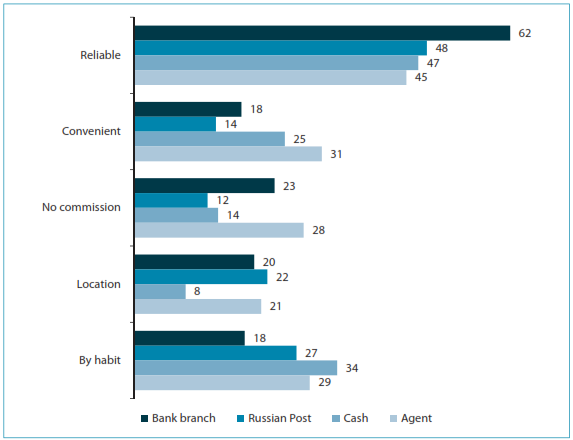
Figure 29. Top five reasons for using transitional channels
Note: Distribution of answers to the question “Why do you plan to use the following delivery channels?” (percentage of total respondents who plan to use respective delivery channels).
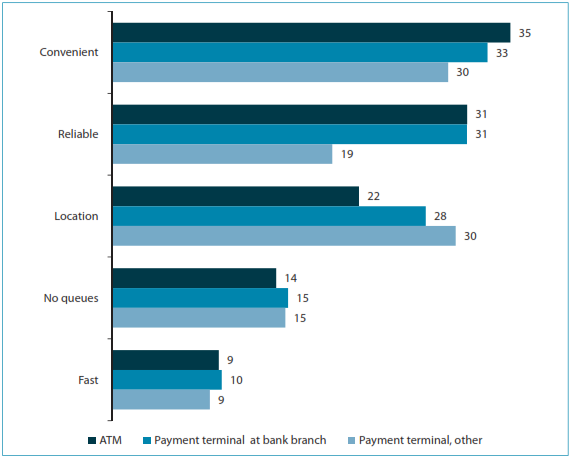
Figure 30. Top five reasons for using innovative channels
Note: Distribution of answers to the question “Why do you plan to use the following delivery channels?” (percentage of total respondents who plan to use respective delivery channels).
Detailed breakdowns of the survey results on the reasons for using financial services and delivery channels are presented in Annex 3.