CHAPTER 2.
USAGE OF FINANCIAL SERVICES
AND DELIVERY CHANNELS
Usage of financial services is the next of the three dimensions of financial inclusion measurement as defined in the G20 Financial Inclusion Indicators. This chapter addresses the usage of various financial services and explores the level of awareness about financial services and people’s intention to use them — as important prerequisites for usage. In addition, statistics on the usage of and awareness about financial service delivery channels are presented.
The chapter is organized as follows:
2.1 Usage
Credit, card-based, and savings products
While card-based products in Russia can generally be considered “savings” products (except credit cards that are shown along with statistics on credit products) as they are usually linked to bank accounts that could be topped-up, statistics on their usage are shown separately to reflect specifics of the Russian financial services market — where many of such card-based products are initiated and provided to people by third parties — such as employers (“salary card” used to transfer staff salaries and benefits) and government (“social card” used for various government-to-person transfers to specific categories — see Glossary in Annex 2).
As shown in Figure 4, with the exception of “salary cards,” the share of Russians using credit, savings, or card-based products does not exceed 18 percent for each product. The relatively high percentage of those using “salary cards” (44 percent) is due to the fact that this product is initiated and provided by employers to transfer salaries to their employees. Similarly, 14 percent of “social card” users reflect the number of government support beneficiaries — who were issued the card by the state but have not actively requested this service.
Figure 4. Usage of credit, savings and card-based products
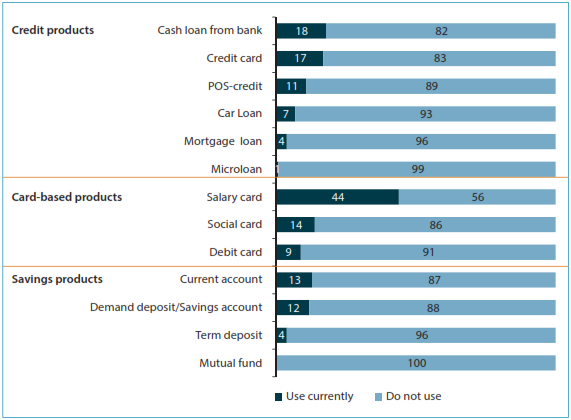
Note: Distribution of answers to the question “What financial products do you currently use?” (percentage of total respondents, n = 2800).
As both salary and social cards are usually regular debit cards linked to bank accounts, this allows their holders to transact and use other services, such as payments, money transfers, and savings. The research has not found significant correlations between the fact of having any of the “provided” services and more active use of other financial services. At the same time, a correlation has been established between having any of the card-based products and higher usage of transitional and innovative delivery channels.
Credit products are used more often than savings products — in total, 39 percent of respondents have some of the credit products, and only 24 percent have used any of the savings products (the latter figure includes 15 percent of those with term deposit/savings account). Among credit products, Russians use shorter-term, higher-risk products more actively — such as short-term cash loans from banks, credit cards, and POS credit. This is not surprising as consumer credit has become more accessible in recent years — for example, in 2013, the volume of consumer lending by banks in Russia grew by some 40 percent, according to the Central Bank.31
At the same time, the volume of natural persons’ deposits has grown by 20 percent in the same year.32 Among the savings products, longer-term instruments are the least used: only 4 percent of people have term deposits, and less than 1 percent have investments with mutual funds.
There are significant regional variations in the level of financial service usage:
— The Central FD has the highest share of residents using current accounts (24 percent versus 13 percent across Russia). In Moscow, 22 percent use debit cards versus 9 percent Russia-wide.
— Both the Central and Northwestern FDs show higher usage of card-based products (especially salary cards), which may be explained by high employment levels in these regions.
— The Siberian and Far Eastern FDs show the highest levels of short-term credit product usage — cash loans from banks (30 percent and 25 percent versus 18 percent average), credit card (24 percent in Siberia versus 17 percent average), and POS credit (24 percent in the Far East versus 11 percent average).
— In the Volga FD, credit card usage is only 11 percent — 6 percent lower than the average.
— Residents of the Southern FD hardly use debit cards — only 1 percent mentioned using this product as compared to 9 percent Russia-wide.
— The North Caucasian FD has the lowest level of salary card usage — 23 percent; this is followed by the Volga FD with 37 percent — as compared to 44 percent on average. As mentioned above, this corresponds to employment levels in these regions.
— With higher usage figures on credit products, the Siberian FD shows a much lower usage of savings products — only 6 percent use demand deposit/savings account and another 6 percent use current accounts. These are only half of the respective national average figures.
— St. Petersburg (capital of the Northwestern FD, where the usage is higher than average overall) is showing much lower figures of cash loan usage — only 2 percent compared to the average of 18 percent.
— The Urals FD is characterized by higher than average usage of mortgage and car loans — 8 and 9 percent, respectively, as compared to 4 percent and 7 percent Russia-wide. At the same time, only 6 percent of residents of this region use POS credit, as compared to 11 percent Russia-wide.
Another factor accounting for significant differences in the usage of financial services is the level of income:
The analysis of credit, card-based, and savings products usage has not revealed significant correlations with such sociodemographic factors as gender and age of respondents.
Detailed breakdowns of the survey results on the usage of credit, card-based, and savings products are presented in Annex 3.
Insurance products
Similar to the financial products discussed above, among the insurance products used most frequently are mandatory products — such as mandatory motor third-party liability (MTPL) insurance for car owners (22 percent) and products initiated by third parties — such as employer-provided voluntary health insurance (17 percent) (Figure 5).
The research revealed an unusually high level of the voluntary health insurance usage — 24 percent. During the qualitative research, and also with support from data from prior NAfiresearch, it became apparent that many respondents confused this product with the free universal public medical care program (which is called “mandatory medical insurance”). Since in 2012 the share of those using this product was about 5 percent (NAfi2013), it is most likely that it is currently at a similar level.
Figure 5. Usage of insurance services
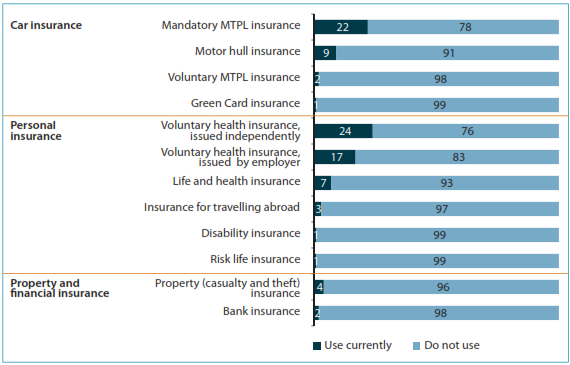
Note: The data on voluntary health insurance usage presents perceived usage; the actual usage is about 5 percent. Distribution of answers to the question “What insurance products do you currently use?” (percentage of total respondents, n = 2800).
Note that the figures for bank insurance usage (2 percent) do not correlate with the statistics on credit product usage (ranging between 4 percent and 18 percent for various credit products) — although most banks require insurance as one of the conditions for loan disbursement — especially for larger and longer-term loans (mortgage and car loans). While legally banks cannot make any loan insurance mandatory, they usually offer better conditions on loans with such insurance, or sometimes just sell “packaged” products where insurance is already included. As a result, respondents have not identified themselves as users of insurance products, and the actual usage level may be higher.
The research has revealed some regional differences in the usage of insurance products, but they are not as significant compared to credit, card-based, and savings products discussed earlier:
In terms of income levels, only 42 percent of the lowest-income category currently use insurance products versus 61–66 percent of those in higher-income categories.
Detailed breakdowns of the survey results on the usage of insurance products are presented in Annex 3.
Delivery channels
Delivery of financial services outside of bank branches presents significant opportunities for the expansion of access to finance. Due to much lower delivery costs compared to traditional banking, branchless banking can reach many more customers and allow for smaller-value transactions at lower costs.33 One of the objectives of this research was to see how many people are using various delivery channels. Unfortunately, there is no time series data available on the use of the channels,34 which makes it impossible to compare how the usage has been changing with time. As such, the data presented here can be used as a baseline for further research.
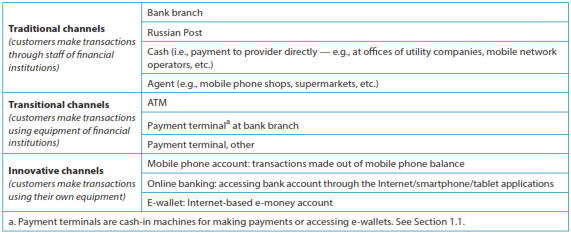
For the purposes of the research, financial service delivery channels are organized into three broad categories as presented in Table 2: traditional, transitional, and innovative channels. This classification reflects customer perspective rather than provider perspective. The channels are grouped based on the types of customer interactions (with staff , provider equipment, own devices) rather than the type of provider (bank or nonbank).
Table 2. Financial services delivery channels
As shown in Figure 6, Russians tend to use traditional channels the most. Not surprisingly, innovative channels are the least frequently used. As mentioned earlier, it was found that owners of any card-based products, both “provided” and independently obtained, tend to use transitional and innovative delivery channels more often than those who do not use these products.
Figure 6. Usage of financial services delivery channels in the past 12 months
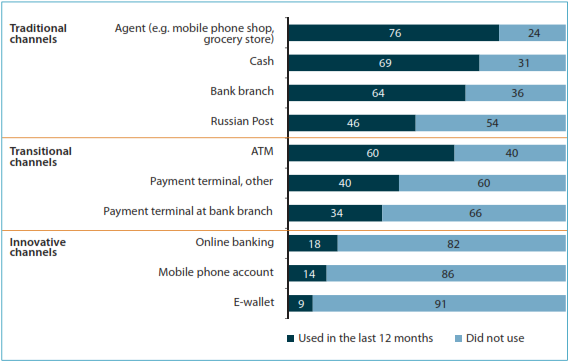
Note: Distribution of answers to the question “Which of the delivery channels have you used in the last 12 months?” (percentage of total respondents, n = 2800).
Statistics on using payment agents in the past 12 months turned out higher than for other traditional channels. This is likely because payment agents are mostly used for the most popular and frequently used type of payment — the mobile phone, for which payments are made by 90 percent of respondents, 65 percent of whom pay several times a month (see Figures 6 and 7).
As is the case with financial services, usage of delivery channels varies by regions:
The usage of delivery channels also varies by income levels and age of respondents:
Finally, more active users of innovative channels are those who use the Internet more actively: among those using the Internet daily, 66 percent of respondents use innovative channels versus 26 percent Russia-wide.
Figure 7 shows the most popular types of payments made through financial service delivery channels.35
Figure 7. Types of payments
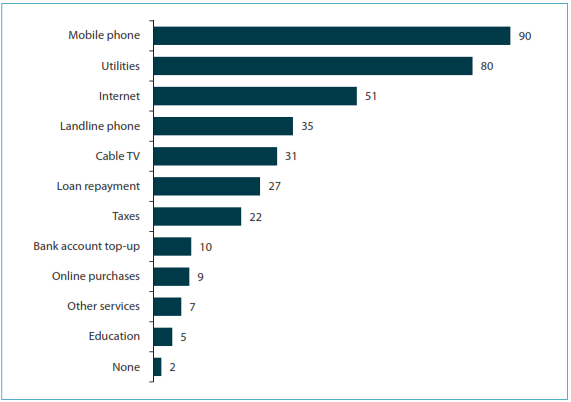
Note: Distribution of answers to the question “What payments do you regularly make?” (percentage of total respondents, n = 2800).
About 90 percent of respondents make various payments at least monthly. Figure 8 summarizes the types of payments, percentage of users, and payment frequency. Together with information on customer perceptions about the channels in terms of their reliability and safety (see Chapter 3) , and information on preferred delivery channels for different types of payments (which were explored through qualitative methods only during this research), this can provide useful information for financial service providers about the potential for using the channels to expand financial service offerings. Thus, the focus groups revealed that customers prefer to pay for mobile phones mostly through payment agents (which explains the high usage rates of this channel as mentioned above) and payment terminals. Additional research is needed to obtain detailed statistics on this.
Figure 8. Frequency of payments
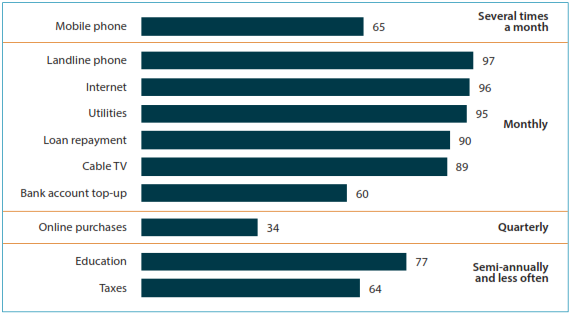
Note: Distribution of answers to the question “How frequently do you pay for…?” (percentage of total respondents, n = 2800).
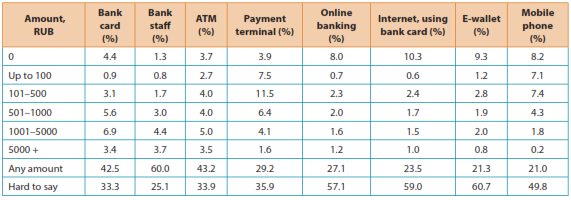
Another factor that could shed light on the potential for expanding the use of transitional and innovative channels for services other than payments is customer sensitivity to amounts that they are ready to pay through available channels. Research by the Central Bank of the Russian Federation (2014) (Table 3) suggests that customers tend to prefer paying higher amounts through banks and bank-operated infrastructure and channels, which correlates with a higher level of trust in banks (see Chapter 3).
Table 3. Distribution of answers to the question “What amount will you be ready to pay through each of the following channels?” (percentage of total respondents, n = 3209)
Detailed breakdowns of the survey results on the usage of financial service delivery channels are presented in Annex 3.