Moving average lines are used by traders to identify support and resistance areas and to generate buy or sell signals.
Introduction:
Moving averages are essentially a set of data points which in the case of an assets price is a chosen number of closing prices during a specific period of time, which are joined together by a line. The data is then drawn on a price chart, most commonly a candlestick price chart.
The time periods most commonly used are 1 minute, 5 minutes, 15 minutes, 30 minutes, 60 minutes, 4 hours, daily and weekly. The most common number of moving average series of closing prices used is 5, 10, 20, 50, 100 and 200. Moving averages are used to identify price trends and also support and resistance levels.
Moving Averages:
Moving averages are calculated by adding the number of closing prices for the number of periods chosen and then dividing the total by the number of periods. For example if we had a 10 period moving average on a 60 minute time frame, the closing prices for the last ten hours are added together and then divided by 10. The result would be the latest data point and the last data point or closing price would be dropped. An example of this has been drawn on the EUR/USD price chart below.
As you can see the moving average smoothes out the price action, it also indicates whether the price action is bearish or bullish. If the price action is below the moving average it is bearish and if it is above the moving average it is bullish.
The moving average can also act as a support and resistance level.
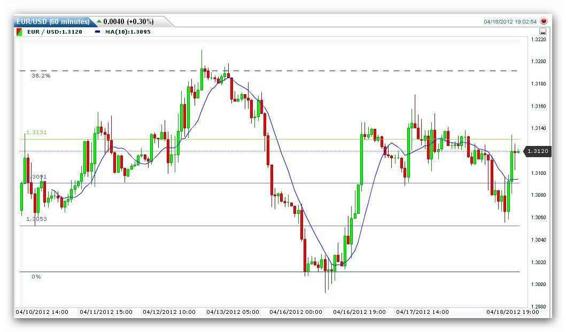
On the chart above notice how on the up trending price action the moving average acts as a support line whereas the moving average acts as a resistance level for down trending price action. The lower the number of periods the closer the moving average is to the price action and the higher the number of periods the smoother the moving average becomes.
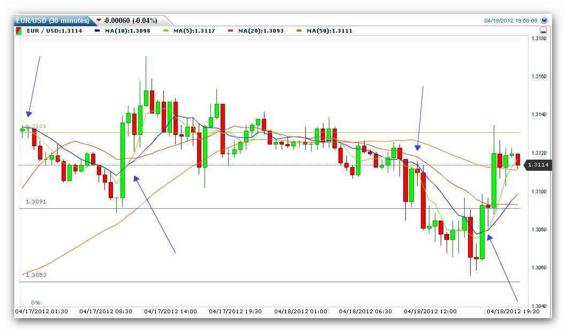
Because of this many traders use moving averages to indicate forex trading entry and exit points by using two or more moving averages of different periods. This technique is called the moving average cross over because the faster (low number of periods) moving average will cross down through the slower moving average (higher number of periods) to give a sell signal.
Conversely the faster moving average crossing above the slower moving average will give a buy signal.The Forex chart type below shows how two moving averages are used to give buy and sell signals. The green 5 period moving average is the fast moving average and the blue 10 period moving average is the slower moving average. Where they cross is the buy or sell signal (indicated by the arrows). Two further moving averages (20 and 50) have been drawn on the price chart to show how longer period moving averages smooth out the price action.
The moving averages we have just described and shown on the chart are called simple moving averages (SMA).
There are also moving averages which are called exponential moving averages (EMA). These types of moving average put more weight on the most recent closing prices and therefore the moving average line follows the price action much more closely than the simple moving average. Traders tend to use the ETA as the fast line when using moving averages to generate buy and sell signals. Historically however, there is no evidence that an EMA is any more profitable than an SMA, so most traders use the SMA.
Article source: etoro.com