Indicator setting set ups are important for traders to know in relation to their trading style and their trading strategy.To be a successful trader whether it is in forex, stocks or commodities it is not only essential that you understand and use technical indicators properly but also that you know how to set these indicators up correctly. Nowadays all trading stations have embedded in them most of the common indicators with default settings which in the main are the most efficient. Some however you will need to change to your particular trading style.
Mastering Simple Moving Average (SMA)
The Simple Moving Average indicator is one of the most common indicators used by traders today. It is a lagging indicator and needs to be set up efficiently if the trader is going to trade successfully using it.
If you intend using just one Simple Moving Average line then this should ideally set to 10 time periods. This setting avoids most of the whip saw effect and false signals that a fast indicator would give. A longer setting would lag too much behind any change in trend direction and would not be such a profitable indicator. When using one SMA wait for the candles to be completely free of the line before you open a trade.
If you trade using the SMA crossover you can use either two or three SMA lines set at different time periods. The ideal settings for two SMA’s is a fast SMA set at 5 periods and the slower SMA set at 10 periods. In this type of set up the trade is entered when the faster SMA crosses the slower SMA and it is exited when it crosses back the other way.
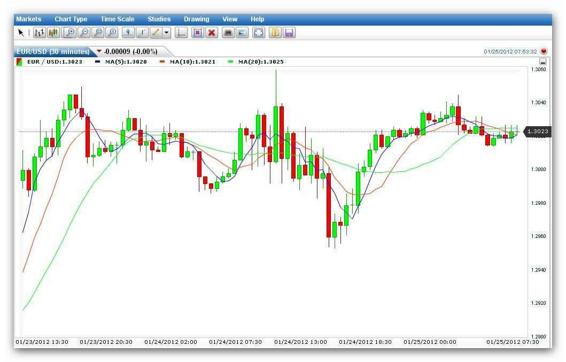
Using three SMA lines the set up for the fast and medium SMA are set at 5 and 10 periods while the third and slowest SMA which acts as a support and resistance line is set at 20 periods. When using this set up you should wait until both the 5 and the 10 SMA lines cross the 20 SMA line giving a buy or sell signal before making a trade. These types of set up are used for short term trading strategies rather than long term trading strategies.
For long term forex trading strategies the SMA’s should be set at longer periods. The fastest SMA is best set at 50 periods and the slowest SMA at 200 periods. Once again a buy or sell signal is given when the fast SMA crosses the slow SMA downwards or upwards respectively.
The Exponential Moving Average set up are the same as the SMA set ups, however there is no evidence to suggest that the EMA is any more profitable than the SMA. The EUR/USD hourly chart below shows a short term SMA trading set up.
The other popular indicators such as the Relative Index Indicator and the Stochastics are set at 14 periods for the best results whilst the Moving Average Convergence Divergence is best set at the 9,12 and the 26 period EMA for the most accurate buy and sell signals.
Article source: etoro.com
Mastering Triangular Moving Averages
The triangular moving average is a simple moving average where the average has been averaged to create a smoother line.The triangular moving average (TMA) is essentially a simple moving average which has been averaged again. In other words the average has been averaged. What this does is to create a smoother moving average line than the simple moving average line for the same time period.
Does this improve the Forex signals that a trader can get from a moving average? The advantage if any is very slight and there is no evidence that a triangular moving average is more profitable than a simple or an exponential moving average.
Mastering Triangular Moving Averages:
Traders use a triangular moving average in exactly the same way as a simple moving average (SMA) or an exponential moving average (EMA).
The SMA is probably the most popular technical indicator with traders at this point in time and has been for some time now.
As we can see from the EUR/USD daily chart and window below we have a 10 day SMA (blue), a 10 day EMA (green) and a 10 day TMA (red).
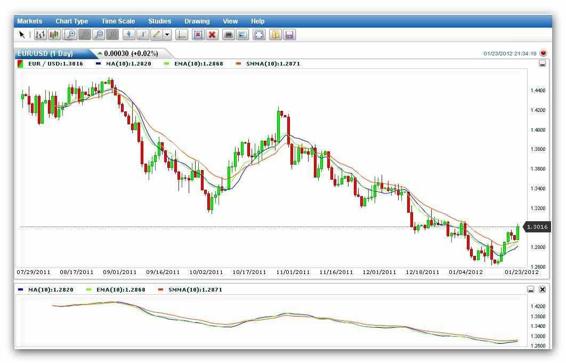
Notice how the TMA is a far smoother line. It is particularly noticeable in the window rather than on the price chart. Notice too how the EMA is more responsive to price on the price chart.
In fact the EMA is in many cases is one day or one candle faster than the SMA. However, because the EMA is more responsive to price changes it is more likely to send out false signals because of the whipsaw effect. The TMA shows a far more smooth line and can be used as a trading indicator although you need to wait patiently for the right signal. When the price is on an uptrend, the moving average will be on an uptrend, and the moving average line will be tested by the price and the price will bounce off the moving average a few times so that the moving average serves as a support line. A good strategy is to then buy on one of the retracements back to the Triangular Moving Average line.
When the price is in a downtrend with the moving average in a downtrend also, the price tests the TMA above and is rejected several times. The TMA is now serving as a resistance line and so the strategy here is to buy on the rallies up to the TMA line.
The two examples mentioned above are using one Triangular Moving Average; however, traders often use two or three Triangular Moving Averages. The advantages in using more than one moving average are explained below.
How to apply triangular moving averages to a possible trade:
The advantage of using three moving averages is clearly that the buy or sell signal is much stronger than simply using one or two moving averages. In the GBP/USD weekly chart below there are three TMA lines; an 11 period (green), a 20 period (blue) and a 50 period (red). There is one buy and one sell signal indicated by the blue arrows over a 16th month period.
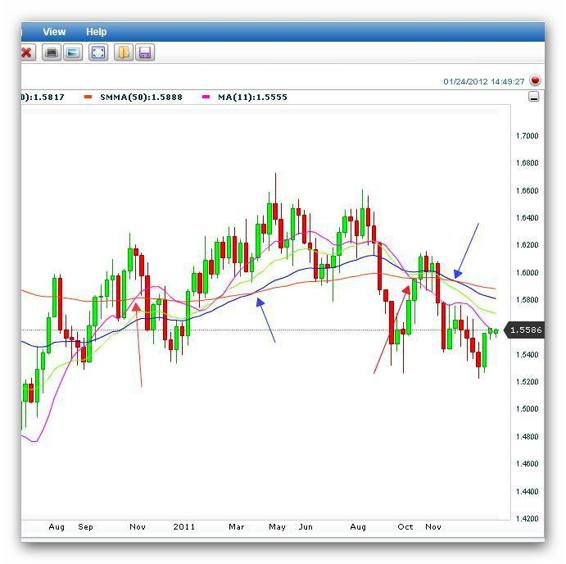
This shows how the smoothing out of the triangular moving average reduces the number of buy and sell signals. Superimposed on the chart is a simple moving average 11 period line. Notice how the SMA signals a buy and sell (red arrows) much earlier than the TMA.
Article source: etoro.com
Mastering TRIX
TRIX is a combination of a leading momentum indicator and an oscillator, which eliminated market noise and therefore gives the trader a stronger buy or sell signal. Jack Hutson, a writer for a technical analysis magazine, first introduced the triple exponential average (TRIX) to the forex trading world. The triple exponential average (TRIX) indicator is an oscillator which can be used to recognize oversold and overbought price conditions in markets, as well as being used as an indicator which measures momentum.
Mastering TRIX:
Like most oscillators, TRIX moves around a line centered on zero. When used as an oscillator, a value above the zero line is a positive value and shows an overbought market while a value below the zero line which is a negative value shows an oversold market.
When using TRIX as a momentum indicator, a positive value implies increasing momentum while decreasing momentum is indicated by a negative value. A lot of traders consider that once the TRIX has crossed above the zero line it indicates a buy signal, and when it crosses below the line, it’s a sell signal.
The main advantages of TRIX over other indicators which are considered trend following is its exceptional filtration of the market noise and its propensity to be a leading indicator rather than a lagging indicator.
It manages to filter out market noise through the calculation which removes the small short term cycles that often indicate a false change in the direction of the market. It also has the capability to lead a market since it measures the disparity between each price candles "smoothed" adaptation of the price. As with any technical tool, when used as a leading indicator, TRIX is better used in combination with other market indicators to minimize false signals.
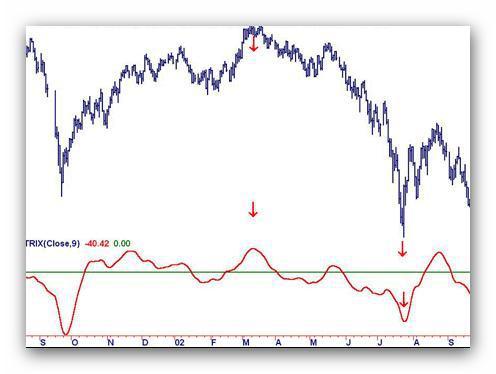
On the example of a TRIX indicator on the chart below you can see clearly that there is very little lag between when the price starts to turn down and the TRIX moves from a positive number above the centre line to a negative number below the centre line. Most charting software uses a 9 time period as a default for TRIX.
How to apply TRIX to a possible trade:
As with all moving averages, Stochastic and momentum indicators using more than one indicator offers the trader a major advantage. By following the fast moving indicator cross either up over or down under the slower moving indicator the trader can identify a change in the momentum or direction of the price action. This enables the trader to identify with more certainty a buy or a sell signal.
When the faster moving index crosses below the slower moving average this indicates a sell and when the faster moving averages crosses above the slower moving average this is a buy signal.
Article source: etoro.com
Mastering the Volatility Ratio
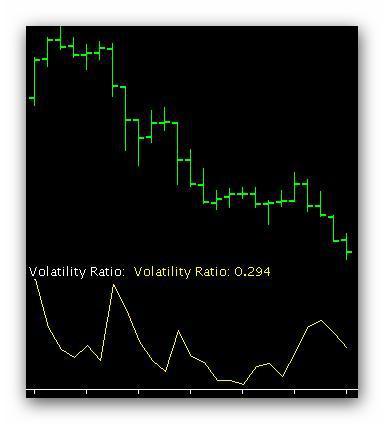
The Volatility Ratio is an indicator which identifies the moment when a price breaks out of a ranging pattern in a bullish pattern or bearish pattern.
The Volatility Ratio is an indicator which identifies price ranges and also price range breakouts. It does this by calculating an adaptation of the price range which is called the current true range, and thereby identifying the moment the price has dropped outside this current price range.
The chart below shows how the Volatility Ratio is presented as a single line in a separate window from the price chart.
Mastering the Volatility Ratio:
The Volatility Ratio is therefore used to recognize breakouts in other words when the price has moved out of its most recent price range. The Ratio can be used in all markets that are traded however the level at which a breakout is signaled is not the same in each market.
However, the most popular level is the level at which the current range is twice that of the most recent range and that is indicated on the scale as 0.50. If the Volatility Ratio is combined with one of the popular volume indicators the volume indicator would support and confirm the breakout.
A breakout is defined as price movement which breaks through an obvious level of support or resistance. This break is more often than not accompanied by very heavy volume and greater than before volatility.
Forex traders will usually buy the asset if the price breaks through a level of resistance and sell when it breaks through a support level. In practice the term breakout applies to prices breaking upward in a bullish direction. When prices break downwards through a support level it is termed a breakdown and has a bearish flavor.
How to apply the Volatility Ratio to a possible trade:In essence the Volatility Ratio is traded in the same way as a momentum technical indicator or an oscillator as the key number is 50% or 0.50. If the Volatility Ratio is greater than 0.50 then the trader will either buy or sell the underlying asset depending on whether the price range breaks upwards (bullish) or downwards (bearish).
If you want to use the Volatility Ratio as a technical tool it should be used at least in combination with a volume indicator such as the Volume Oscillator.
Article source: etoro.com