How to Trade a 1% Price Strategy
Trading a 1% pricing strategy can be accomplished with any currency pair however the time frame should be daily.One of the strategies which give traders a chance to trade along with the trend is the 1% strategy for forex price action. This strategy has a rule which says that the stop loss should be 1% lower or higher than the entry price and the take profit or exit is defined if the trend reverses by 1%.
How to Trade a 1% Price Strategy:
This strategy can be used with just about any currency pair and the time frame used is the daily time period. The strategy is played out on a candlestick chart with only 100 EMA indicators being used as the technical tool.
A buy signal happens when the previous daily close is 1% lower than the current daily close and the price is moving above the 100 exponential moving average. The stop loss should be placed exactly 1% below the price that the trade was entered. The trade is then followed and only closed out when the current daily close is 1% below the previous daily
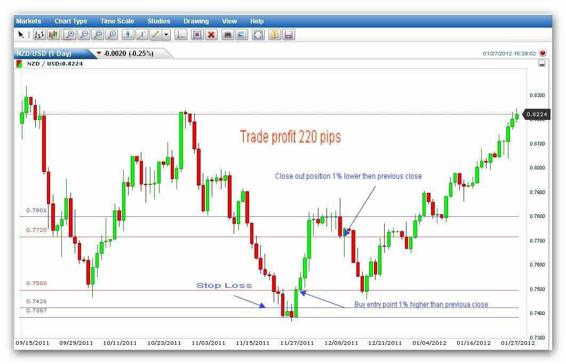
In the example on the NZD/USD daily chart above an entry signal was given at the 0.7500 price on the candle where the close was 1% higher than the previous close. The stop loss was placed at the price of 0.7425 which was 1% below entry price. The trade was allowed to run until a candle with a close 1% below the previous candle appeared. This was at a price of 0.7720 giving the trade a profit of 220 pips.
A sell signal happens when the previous daily close is 1% higher than the current daily close and the price is moving below the 100 exponential moving average. The stop loss should be placed exactly 1% above the price that the trade was entered. The trade is then followed and only closed out when the current daily close is 1% above the previous daily
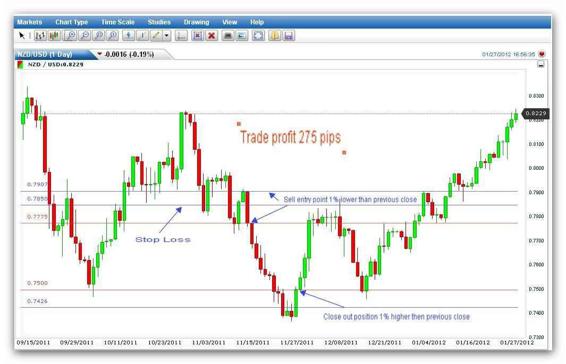
In the example on the NZD/USD daily chart above an entry signal was given at the 0.7775 price on the candle where the close was 1% lower than the previous close. The stop loss was placed at the price of 0.7850 which was 1% above entry price. The trade was allowed to run until a candle with a close 1% above the previous candle was formed. This was at a price of 0.7500 giving the trade a profit of 275 pips.
Article source: etoro.com
How to Trade a 15 Pip Breakout Scalpers Strategy
The 15 pip breakout scalper’s strategy is specifically designed to scalp 15 pips on 1 minute time period volatile currency pair charts.The 15 pip breakout scalping strategy has been developed specifically for trading volatile currency pairs in the one minute time period with the utmost accuracy. The currency pairs that can be traded are the EUR/USD, the GBP/USD, the NZD/USD and the USD/CHF and they should be traded during the European and USA sessions for the most volatility. The stop used is rather narrow at 6 to 8 pips and the target profit is 14 pips or more.
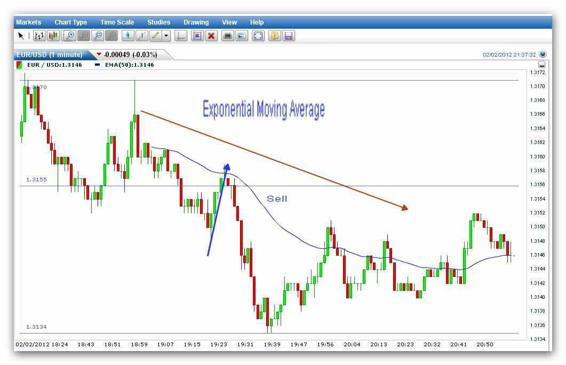
The 15 pip breakout scalping sell strategy is demonstrated by experienced forex traders on the EUR/USD 1 minute candlestick chart above.The 50 period exponential moving average line shows that the EUR/USD is on a down trend. An upward trend line is drawn where the prices are rising and we wait until the closing price breaks below the trend line.
This is a sell signal and at this point we sell as in this example at 1.3155 and set our stop loss at 1.3160 which is 5 pips above the price we sold at. This particular example would have given the scalper 21 pips profit if the short position was liquidated at the price of 1.3134 however as the target profit level is 15 pips the scalper would probably have liquidated the short position earlier.
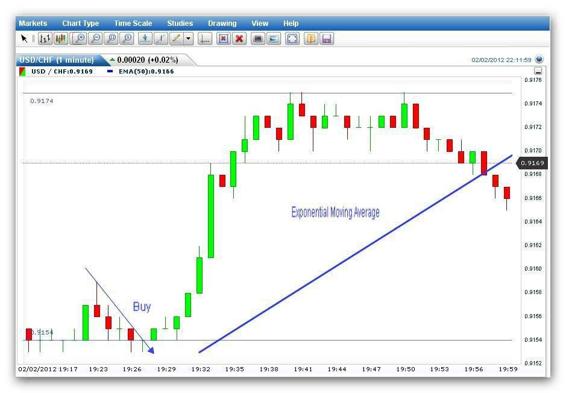
The 15 pip breakout scalping buy strategy is demonstrated on the USD/CHF 1 minute candlestick chart above. The 50 period exponential moving average line shows that the USD/CHF is on an up trend. A downward trend line is drawn where the prices are falling and we wait until the closing price breaks above the trend line.
This is a buy signal and at this point we buy as in this example at 0.9154 and set our stop loss at 0.9149 which is 5 pips below the price we bought at. This particular example would have given the scalper 20 pips profit if the long position was liquidated at the price of 0.9174 however as the target profit level is 15 pips the scalper would probably have liquidated the long position earlier.
Article source: etoro.com
How to Trade a Bollinger Band Reversal Strategy
A Bollinger Band is a simple technical analysis tool which indicates an imminent reversal from the current trend.
A Bollinger Band is an indicator which takes a 20 period simple moving average which defines the intermediate term trend of the price and also uses two standard deviations of the instrument being traded to work out the width between the simple moving average and the bands.
The top band is plus 2 deviations above the middle line (moving average) and the bottom band is minus 2 deviations below the middle line (moving average). The bands are not support or resistance levels such as those derived from pivot points and there is no calculated data that says that prices should stay within the bands.
However, most of the time the prices do stay within the bands and this is something that the trader can use to trade Bollinger Band strategies. Traders who use the traditional technical analysis on candlestick charts like double bottoms and tops, head and shoulders patterns and other candlestick patterns can strengthen their analysis by using the Bollinger Bands indicator.
Bollinger Bands can help traders understand where the price is going. Is it trending, is it ranging or is it volatile. When the bands are very close together the asset is trading in a range that is very narrow and when the bands are far apart this indicates volatility, price breakouts and large rallies.
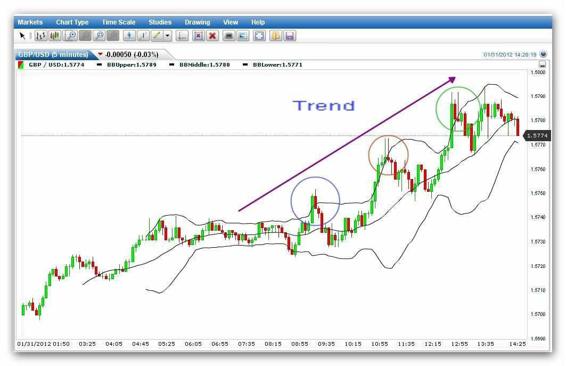
In the chart above notice how from 06:55 to 08:55 the upper and lower bands are close together and very near the line of the moving average. After 08:55 the bands start to widen and move away from the moving average line as the currency price becomes more volatile and a trend begins to develop.
If the asset price drops outside of the bands either below the lower band or above the upper band the price is considered to be ‘breaching the bands’. This happens during times of extreme versatility and is the signal given out by Bollinger Bands is that a reversal in trend is impending.
As the outer bands are two standard deviations from the moving average this means that 95% of the time the price will stay within the band limits and 5% of the time the price will breach the outer bands.
The Bollinger Band reversal strategy is a very simple yet effective strategy for a forex trader to have in his tool kit of strategies. Where two or more candles close above the upper band or two or more candles open below the band then this usually is a strong signal that there is an imminent reversal.
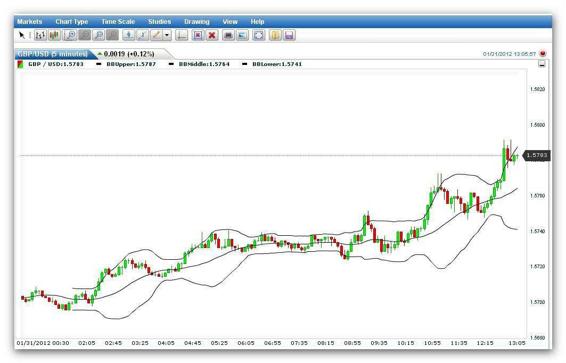
The GBP/USD 5 minute price chart below displays three such breaches of the outer Bollinger Bands.
The first instance of a reversal (the blue circle) did not have a strong signal as the green candle closed above the line and the red candle below the line, however there was a small reversal. At 10:55 the chart showed three closes in a row (red Circle) above the upper band, a very strong signal for a reversal.
The trend reversal lasted until 12:20 when the underlying upward trend continued. Around 13:00 the chart shows two things. Firstly we have two candles closing above the outer band and secondly a typical tweezer candlestick pattern (green circle) confirming the imminent reversal.
Although the total pips profit from these three reversals was around 60 pips it still would have been a very profitable series of trades for a day trader. Bollinger Bands can be used on any timeframe with equally good results.
Article source: etoro.com
How to Trade a Doji Breakout Strategy
Doji candlesticks have opening and closing prices that are very near each other in a given time frame signifying market uncertainty and also a possible bullish or bearish breakout.Every forex trader knows and probably uses Japanese Candlestick charts when trading. They add to these charts the technical analysis indicators they have learned to use, such as momentum, leading, lagging and volume indicators.
However, there are also 40 candlestick patterns which a trader should be familiar with. All these patterns are genuine in indicating price direction and all are not difficult to learn. Of the 40 there are 12 which are the major patterns while the remainder which is considered minor is merely used as confirmation of the indications given by the major patterns.
The Doji looks like a type of cross and is a single candle where the opening and closing price are the same or very close to the same in the particular time frame being used.The horizontal line signifies the open and close during the specific time frame. The vertical line signifies the high and low trading range for the time period in question. The prices travel up and down during the period but close on or near the opening level. The upper and lower shadows vary so that the Doji can look like a plus sign, inverted cross or normal cross.
The significance of a Doji is that there is a strong battle between the market buyers (bulls) and the market sellers (bears) and there is extreme indecision in the market. A Doji that is seen at the top of a trend usually signifies a reversal as does a Doji seen at the bottom of a trend.
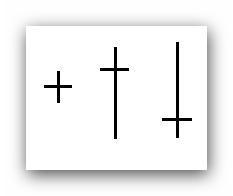
The Doji which looks like a plus sign is the ultimate indication of indecision as to which direction the market is going. If the market is in an overbought condition or an oversold condition this shaped Doji indicates a probable market reversal. This Doji is named the Long Legged Doji.
The Doji which looks like a cross because its body is near the upper end of the trading range of the day usually appears on the opening of the day where the price trades lower after opening and then trades higher so that the close is near the opening towards the high of the day.
This Doji is called a Dragonfly and if it falls in the middle of a trading range it signifies very little however if it falls at a support level then it signifies the likelihood of a bullish breakout at the end of a bearish trend.
Finally, the Doji which looks like an inverted cross is called the Gravestone Doji and this candle signifies when at the top of a bullish uptrend that there could be a bearish breakout and if at the bottom of a downtrend a bullish breakout.
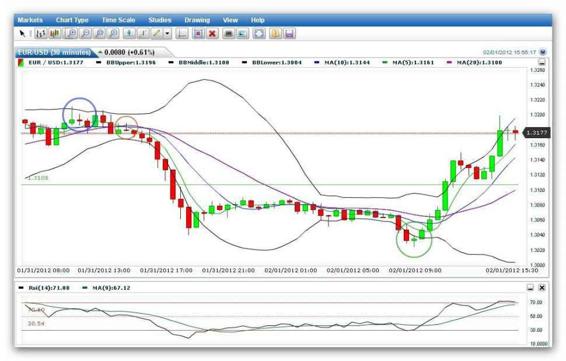
In the chart above there are several Doji candles. The blue circle has two Gravestone Doji’s in the middle of a ranging price and don’t signify any major changes to the price. However, the Graveyard Doji in the red circle signifies a strong bearish breakout.
As with all technical analysis tools the trader should always confirm using another indicator. In this case the Relative Strength Index is crossing down over 50 line into bear territory. After the bearish trend the price ranges and there are several Doji’s amongst the candles which have no influence on the price.
However, on the 1st February a Dragonfly Doji signifies a bullish breakout which is confirmed by both the moving average cross over and the RSI bouncing up from an oversold condition. A trader trading the Doji’s in the red and green circles would have made over a 280 pip profit.
Article source: etoro.com
How to Trade a Fibonacci Day Trading Strategy
A Fibonacci day trading strategy uses the key Fibonacci numbers to show support and resistance levels and an RSI as confirmation of a sell or buy signal.
One of the most important considerations for any day trader is where the support and resistance level lie on a price chart. Knowing he support and resistance levels helps traders know where the entry and exit points are.
The Fibonacci retracement levels which are based on the Fibonacci numbers and the ‘golden ratio’ have become a very important tool for day traders. In the Fibonacci number sequence the ratio between two numbers is 0.618 and the ratio between the higher of the two numbers and the number below the next number down is 1.618.
These two ratios are called the ‘golden ratio’. Therefore the two most important retracement levels for a day trader are 38.2% and 61.8%. Other important retracement percentages for traders are 50% and 75%.
All forex platforms have built in technical analysis tools so that there is no need for you to work out the ratios and percentages on your calculator it is all done for you.Currency pair’s prices either trade in a tight range within a long term or short term trend before there is a breakout either in the direction of the trend or a reversal of the trend, or they trade on a price breakout.
The EUR/USD 30 minute chart below shows the Euro trending down from a breakout at the 1.3200 level on the 31st January. Notice that the Fibonacci retracement hasn’t been set to the absolute high or low. You get better results if the Fibonacci is set to a double top or double bottom as in the example below.
The strategy for a day forex trader having confirmation from the RSI which is falling towards the oversold area would be to short the Euro. The downtrend continues beyond the key retracement levels of 61.8% and 38.2% before retracing from around the 25% level back to the 38.2% level.
The day trader seeing the RSI showing an oversold condition at the 25% level would probably square the short position (red circle) and wait for the next entry signal. The entry signal is given when the price starts to retrace from 0% level (green circle) and the RSI bounces off the 30 oversold conditions. The day traders profit target should initially be at 38.2% but if as in this example the price continues to rise 50%, 61.8%, 75% or 100%. The price ignores the first three levels before retracing from the 75% level back to the 50% level and then continuing the uptrend. The day trader should stay in the trade unless the price drops back through the 50% level or the 75% level and take profit at the 100% level.
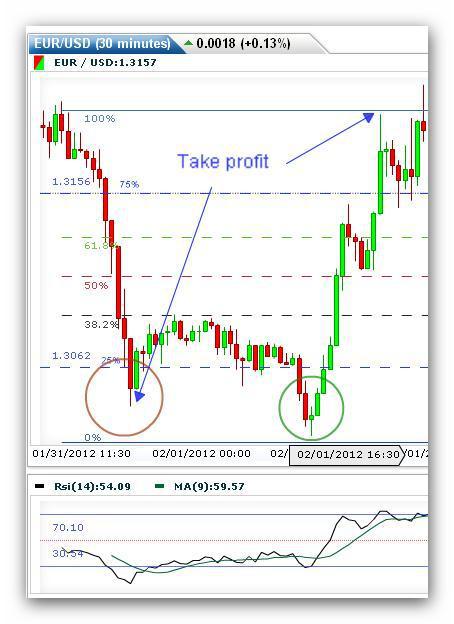
The day trader can also use Fibonacci retracement for a ranging market where the price does not fluctuate that much. The EUR/USD 30 minute chart below is showing a ranging price for the 1st, 2nd and 3rd of February.
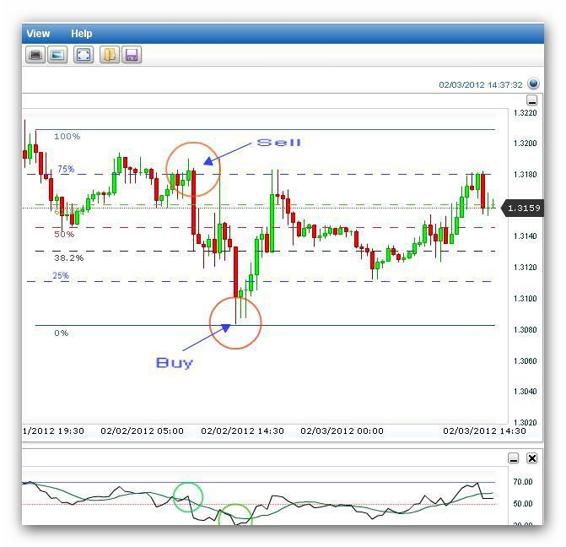
A day trader should look for clear buy or sell signal. The clearest signals on this chart are the sell signal where the price retraces from the 75% strong resistance level (1st red circle) and the RSI is moving from an oversold condition to an overbought condition (1st green circle).
The second clear entry signal is the buy signal (2nd red circle) where the price bounces off the 0% support level and retraces back to the 75% resistance level. The exit for the sell trade should be the price at the 0% support level and the exit for the buy trade at the 75% resistance level.
Stop losses should be set one level below (buy) or above (sell) the entry level. Notice how strong the resistance level is at the 75% Fibonacci line.
Article source: etoro.com
How to Trade a Pivot Point Strategy
A simple Pivot Point Strategy that uses an RSI indicator and three simple moving average lines for confirmation of buy or sell signals.Pivot point trading strategies are used by the ‘big boys’ in the currency markets. The ‘big boys’ are the financial institutions and other big institutions with large treasury departments who trade in the markets.
These groups of traders are the people that trade the biggest volumes in the currency markets and therefore the traders that cause currency prices to go up and down.This is why when prices approach pivot point support and resistance levels the price moves in the expected direction because everyone is looking at the same pivot point price charts and everyone is trading the same simultaneously in huge volumes.
It is therefore extremely prudent for retail traders to follow on the coat tails of the professional traders and trade at exactly the same time and in exactly the same direction.Pivot points are major support and resistance levels where there is likely to be a retracement of price. As such pivot points can serve as fairly accurate entry and exit indicators. The way pivot points are traded and what strategies suit you depends on what kind of trader you are.
When trading pivot points it is best to trade currency pairs that trend. Probably the best currency pairs exchange for pivot point trading are the EUR/USD, the GBP/USD, the USD/CHF, the USD/JPY and the NZD/USD.
The first thing to do is set your pivot points on your chosen currency pair chart. You do not need to know the formula or to calculate pivot points manually as there are plenty of free pivot point calculators on the internet that you can use.
Now let’s look at the EUR/USD 30 minute chart below with pivot points drawn in.
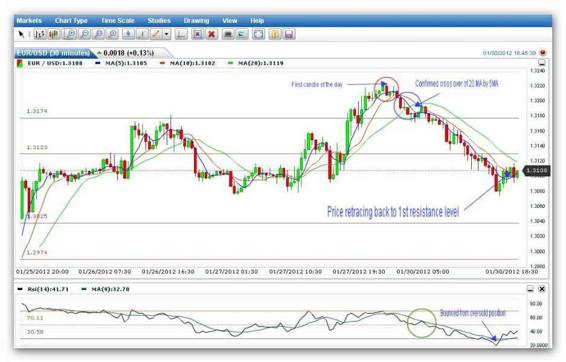
The first thing to notice is the opening candle in the Asian session on the 30th January which is circled in red. The EUR/USD price starts to fall towards the central pivot point which is the green line at 1.3174. An important point to remember is that before you trade you should always make sure that the entry point is confirmed by another indicator.
The blue circle on the candlestick chart confirms the bearish sentiment with a crossover of the 5 period moving average, downwards through the 20 period moving average. Also on the Relative Strength Index the green circle shows the index crossing down over the 50 line towards the oversold area.
These indicators confirm a sell condition and the trader can take a short position in EUR/USD.The price continues to fall and passes through the central pivot point after a small bounce by the bulls. The bears prevail and the price falls towards the 1st support level which it passes through with a small bounce (the green candle) before continuing the bearish momentum.
Halfway between the 1st support level and the second support level, the RSI (indicated by the blue arrow) hits the 20 oversold level and bounces up. The EUR/USD price starts to retrace towards the 1st support level.
The RSI has confirmed a change in sentiment at has given a signal that the trader should close the short position. If the price continues its uptrend and the RSI and 5 MA confirms a buy condition then the trader can open a long position.
He should be aware however that the 1st support level could become a resistance level and the price might retrace back down again.This is a simple Pivot Point strategy that is used in conjunction with an RSI and 3 moving average lines (5, 10 and 20 periods) as confirmation indicators, which can be very profitable if you stick to the rules of the strategy.
Article source: etoro.com
How to Trade a Sustained Break Trading Strategy
A sustained break is a break which has longevity and usually follows a currency that has been ranging or follows an uptrend or down trending market.
A sustained break is a breakout that has the strength and longevity around a support or resistance level. The break is used to confirm that the trade is in the right direction.The length of the break in terms of time depends on each trader’s particular trading strategy as traders will have different support and resistance levels depending on which time frame they are using.
Whatever the time frame as long as the trader knows the critical support or resistance levels any close above or below that level will give a clue as to whether the break will be sustained.
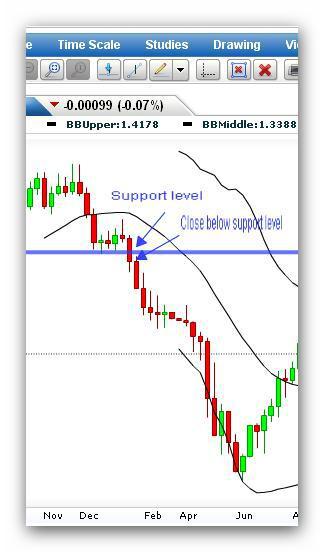
In the EUR/USD chart above the Euro has been down trending and then ranging along the support level closes below the support level. The strategy here would be to go short on the sustained break below the support line.
Your stop loss is best placed at least 5 pips above the support line. This should protect you from being taken out by a quick retracement bounce and also protect you in the event the break is not sustained. Use another indicator to confirm the breakout.
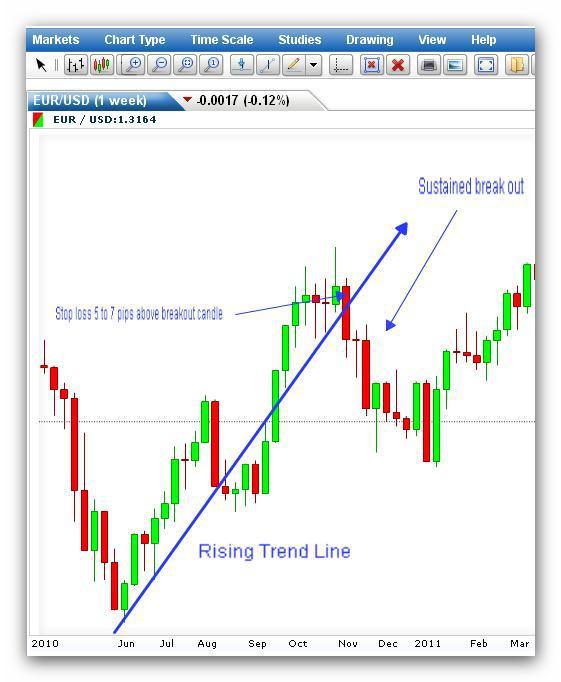
On the EUR/USD chart above the Euro is on an uptrend as the trend line indicates. However, the price then closes below the trend line. This suggests that there is an imminent market reversal. The trading strategy here is to go short once the break below the trend line is confirmed by another technical analysis indicator.
The stop should be set approximately 5-7 pips above the price where the trend line crosses the breakout candle.
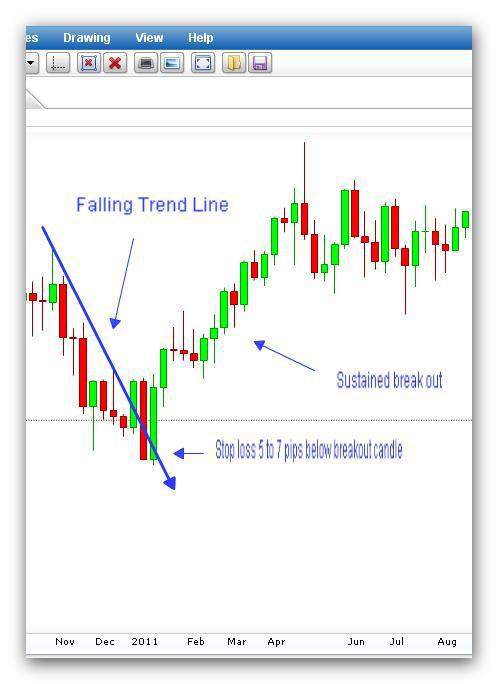
Another strategy available to a forex trader is trading a breakout from a downward trend. On the EUR/USD chart above the Euro is on a downtrend as the trend line indicates. However, the price then closes below the above the trend line.
This suggests that there is an impending market reversal. The trading strategy here is to go long once the break above the trend line is confirmed by another technical analysis indicator. The stop should be set approximately 5 to 7 pips below the price where the trend line crosses the breakout candle.
Finally, you should be careful about the risk reward you decide to use when you set your stop loss and your profit target. Risk is an inevitable part of trading and each trade carries some amount of risk depending on the trader’s actions.
The best way gauge your risk is to determine your risk reward ratio. This is a parameter which reveals how much is being risked versus the probable reward from the trade.If for example you stand to lose $200 from the trade and on the other side you could gain $400, your risk reward ratio is 1:2 which is a pretty conservative ratio and one which is recommended as the minimum.
Article source: etoro.com
How to Trade a Trend Line Forex Scalpers Strategy
A trend line scalper’s strategy is most profitably done on a 1 minute price chart with a stochastic as the confirmation for the entry and exit levels.Forex scalping is not for everyone. It involves being on top of your computer screen for an intense period of time because scalping is a process where the trader opens and closes a position in a short period of time.
A scalping strategy usually lasts between 3 to 5 minutes, although many scalpers are in and out of the market in about a minute. The charting time periods used are the very short periods of 1 minute and 5 minutes. It is a demanding form of trading as the scalper makes a small profit on each trade so he has to trade many times during the trading day.
Sometimes as much as 100 times a day so in this way small gains accumulate to become big gains by the end of the day.A forex scalper needs volatility to be able to make money in a very short period of time. Therefore the best currencies to scalp are the EUR/USD, GBP/USD and USD/JPY. Also the best time frames are between 1pm GMT and 3pm GMT because it is over this period that New York opens while the European markets are of course still open and at this time the most volume is traded.
A very good scalping trading strategy using trend lines uses a stochastic in conjunction with the trend line to signal the entry and exit points.
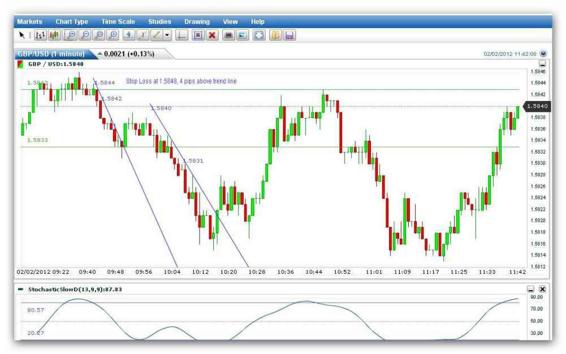
On the GBP/USD 1 minute chart above a down trending line (left hand trend line) has been drawn commencing with the price 1.5844. Notice how the GBP keeps below the line until it breaks it at the 1.5833 price.
The scalping strategy here would be to open a sell trade at 1.5843 in conjunction with the stochastic which is dropping down out of the 80 overbought levels towards the 50 level. A stop loss is placed 4 pips above the trending line at 1.5848. The price objective here should be in the region of 8 to 12 pips.
Wait until the price breaks the trend line and then close out the short position. Closing out at 1.5833 gives the trade a gain of 10 pips. The second down trend line can be traded in the same way when the stochastic moves down into the oversold area below 20. The position is closed out when the trend line is broken or the stochastic moves up from oversold levels above the 20 level.
The scalping strategy for an up trending line is the opposite of the down trending line.
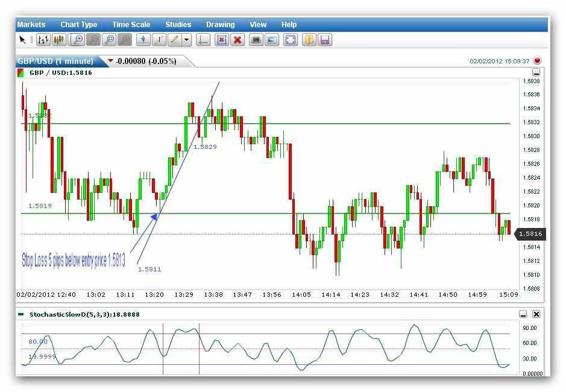
On the GBP/USD 1 minute chart above an up trending line has been drawn commencing with the price 1.5819. The strategy here would be to open a buy trade at 1.5819 in conjunction with the stochastic which is moving up towards the 50 level.
A stop loss is placed 5 pips below the trending line at 1.5814. The price objective again should be in the region of 8 to 12 pips. Wait until the price breaks the trend line and the stochastic is moving down from an overbought condition below the 80 line, and then close out the long position. Closing out at 1.5832 gives the trade a gain of 13 pips.
Article source: etoro.com
How to Trade an RSI Strategy
Trading Relative Strength Index strategies involves simple strategies which if followed can be rewarding for the trader.The purpose of the Relative Strength Index (RSI) is to calculate the comparative changes that happen between the higher and the lower closing prices.
The index is used by traders to establish overbought conditions and oversold conditions which in turn presents them with extremely valuable information to help them set their entry levels and exit levels in the currency markets.
The RSI is an oscillator and its line ‘oscillates’ between the values of zero and one hundred. The values of 70 and 30 are considered important values because above and below them are the overbought and oversold regions respectively.
Any value above 84 is considered a very strong overbought situation and generates a ‘sell’ signal, whereas any value below 15 is considered a very strong oversold situation and generates a ‘buy’ signal.
The very good and simple strategy is to use the RSI to generate a buy or a sell signal. The RSI should be set to the customary 14 periods with a 9 period MA and with the 70 and 30 levels marked as red lines.
Using the NZD/USD price chart below showing a 30 minute time frame with a 9 period MA we will cover a simple buy strategy.
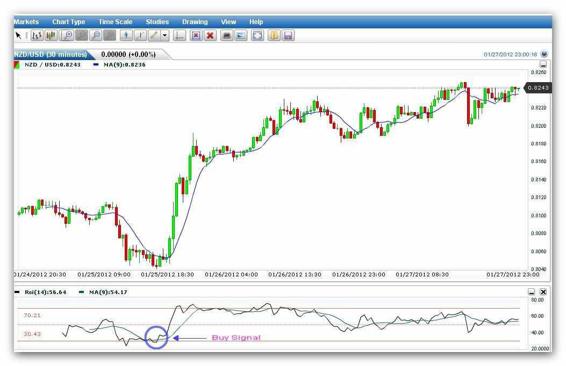
On the 25th of January the RSI generated a buy signal in the area that is circled. It had given a false signal a few hours earlier when the signal line dropped to 24.56. After bouncing the signal line dropped below the 70 again dipping to 28.47.
This time the 9 MA followed it, both on the RSI indicator and the candlestick chart and positive buy signal was generated. There followed a 249 pip rise in price before the index turned down again.
This next strategy shows sell signal and a buy signal on the same chart. Here we have a EUR/USD 1 week chart.
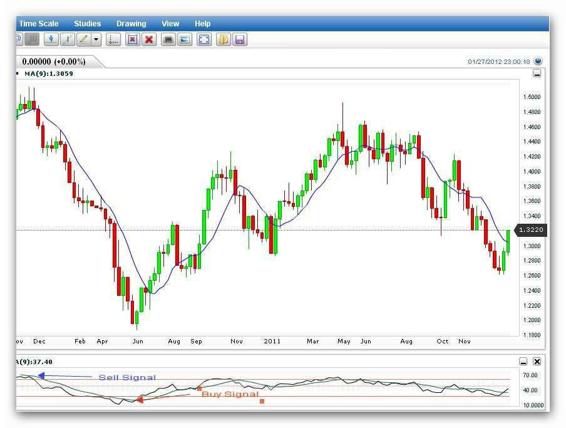
A sell signal is generated in December 2010 when the index turns down from an overbought condition around 75.60 shown by the blue arrow and then dips down to an oversold condition below the 30 line in June 2010, thereby generating a buy signal as shown by the red arrow.
Finally, another very simple forex trading strategy, which is an impressive trading system using two indicators; the RSI and the 5 period moving average. This strategy can be applied to any currency and is best used on a daily chart. Daily charts strategies are ideal for traders who wish to take on a buy and hold strategy.
The rules for this strategy are straight forward in that if the RSI is greater than 50 and the price has crossed up over the 5 period moving average by 10 pips it signals a buy entry.
If the RSI is less than 50 and the price has crossed down over the 5 period moving average by 10 pips it signals a sell entry.
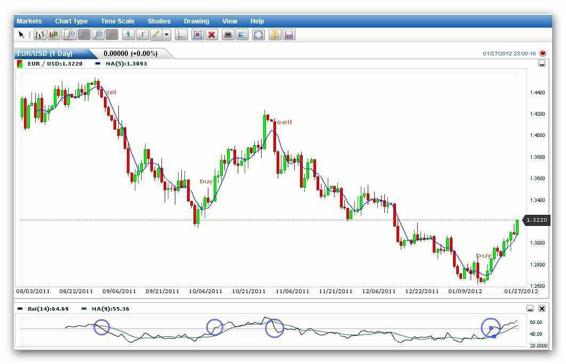
In the daily chart above there are 4 entry points, two sell signals and 2 buy signals. The exit point for a trader in this strategy would be a logical take profit and the use of a trailing stop. My preference is to wait until the index is just about to move back across the 50 line.
Article source: etoro.com
Trading Trend or Range
Trend and range trading are two distinct trading strategies which entail completely different mindsets and money management techniques.
Introduction:
Quite often traders’ especially new traders face a dilemma whether to trade trends or trade ranges. This dilemma not only faces forex traders but also stock traders, futures traders and option traders.
However, even though trading trends or ranges requires two different mind sets and two different types of money management strategies, the forex market is ideal for traders to trade both trends and ranges.
A trend is defined as a series of higher lows (uptrend) or a series of lower highs (downtrend) as indicated by the arrows on the chart below.
Another method of identifying trends is