The fundamental principles of technical analysis are based on the Dow Theory with the
following main thesis:
1. The price is a comprehensive reflection of all the market forces. At any given time, all market
information and forces are reflected in the currency prices (“The market knows everything”).
2. Price movements are trend followers (“Trend is your friend”); trends are classified as up trends (bullish), downtrends (bearish) and flat (sideways). Examples of mentioned trends are given on Figures 4.1 – 4.3.
3. Price movements are historically repetitive (“The history repeats”) which results periodical emerging the same patterns on the charts.
4. The market has three trends: the longest (about 1 year) major, or primary, less enduring (1 month and more) intermediate, or secondary, and rather short (several days or weeks) minor. The primary trend has three phases: accumulation, run-up/run-down, and distribution. In this way, in the accumulation
phase of a bullish market the shrewdest traders enter new positions. In the run-up/run-down
phase, the majority of the market finally "sees" the move and jumps on the bandwagon. Finally, in the distribution phase, the keenest traders take their profits and close their positions while the general trading interest slows down in an overshooting market. The secondary trend is a
correction to the primary trend and may retrace one-third, one-half or two-thirds from the
primary trend. In frame of a major trend may be any amount of secondary or minor trends.
The structure of a bullish trend is shown on Figure 4.5.
5. Trends exist until it is not broken (See Figures 4.2, 4.3) and their reversals are confirmed . Figure 4.4
shows example of reversals in a bearish currency market. The buying signals occur at points A and
В when the currency exceeds the previous highs.
2001 by Royal Forex. All right reserved. www.royalforex.com
23
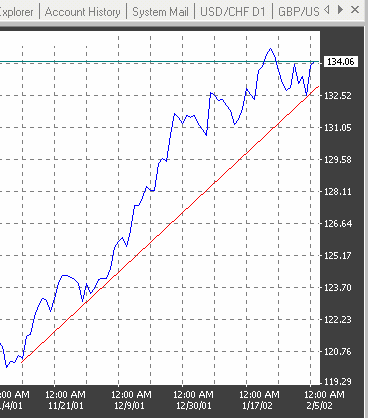
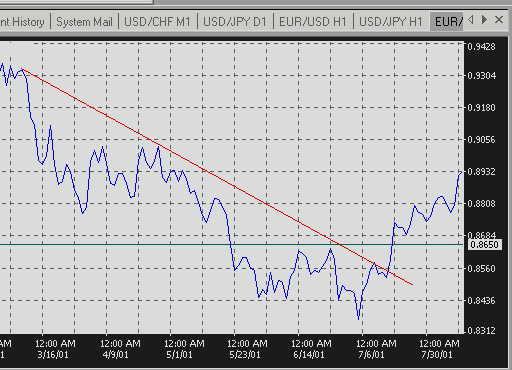
Figure 4.1. Example of a bullish trend in the Japanese yen chart.
Figure 4.2. Example of a bearish trend and a break in the Euro chart.
6. Volume must confirm the trend . Volume consists of the total amount of currency traded within a period of time, usually one day. Large trading volume suggests that there is interest and liquidity in a certain market, and low volume warns the trader to close positions. Open interest is the total exposure, or outstanding position, in a certain instrument. Volume and open interest figures are
available from different sources, although one day late such as the newswires ( Bridge Information Systems, Reuters, Bloomberg), newspapers (the Wall Street Journal, the Journal of Commerce), weekly printed charts ( Commodity Perspective, Commodity Trend Service).
2001 by Royal Forex. All right reserved. www.royalforex.com
24
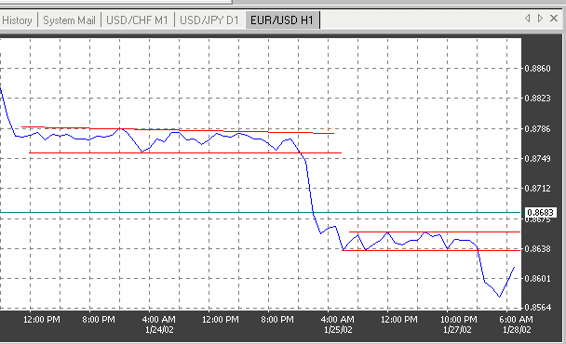
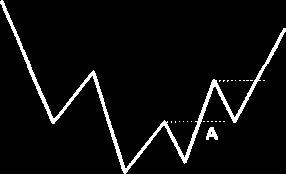
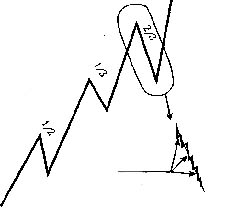
Figure 4.3. Example of sideways and breaks in the Euro chart