Technical analysis provides charts that reinforce the current trends. These chart formations are
known as continuation patterns. They consist of fairly short consolidation periods. The breakouts occur in the same direction as the original trend. The most important continuation patterns are:
1. Flags.
2. Pennants.
3. Triangles.
4. Wedges.
5. Rectangles.
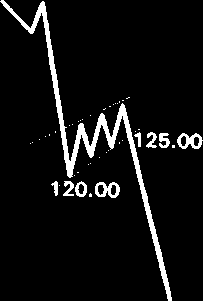
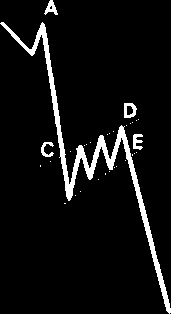
Flags. The flag formation provides signals for direction and price objective. This formation represents a brief consolidation period within a solid and steep upward or downward trend. The
consolidation itself is bordered by a support line and a resistance line, which are parallel to each other or very mildly converging, making it look like a flag (parallelogram) and tends to be sloped in the opposite direction from the slope of the original trend, or is simply flat. The previous sharp trend resembles a flagpole. If the original trend is going down, the formation is called a bearish flag (See Figures 4.29 and 4.30). As Figure 4.29 shows, the original trend is sharply down. The flagpole is measured between points A and B. The consolidation period occurs between the support line ВE and the resistance line СD. When the price penetrates the support line at point E, the trend resumes its fall, with the price objective F, measured from E. The price target is of about equal with the flagpole's length AB, measured from the breakout point through the support line BE. Outgoing from prices in Figure 4.29, the height of the flagpole is measured as the difference between 140.00 - 120.00 = 20.00. Once the support line is broken at 125.00, the price target is 125.00 – 20.00 = 105.00.
2001 by Royal Forex. All right reserved. www.royalforex.com
39