Neckline
Figure 4.21. Diagram of a triple-top formation.
Figure 4.22. An example of a triple-top formation in the Japanese yen chart.
Triple Bottom. Triple Bottom is a hybrid of the double top and inverted head-and-shoulders patterns (See Figures 4.23 and 4.24). As shown in Figure 4.23, in a triple-bottom formation, the
bottoms have about the same amplitude. A parallel line (the neckline) is drawn against the line connecting the three bottoms ( B, D, and F). As a support line, the neckline is broken at point A. It turns into a strong resistance for price levels at С and E, but eventually fails at point G. The resistance line turns into a strong support line, which holds the market backlash at point H. The price objective is at level I, which is the average length of the triple-bottom formation, as measured from point D.
Neckline
Figure 4.23. Diagram of a typical triple-bottom formation.
2001 by Royal Forex. All right reserved. www.royalforex.com
36
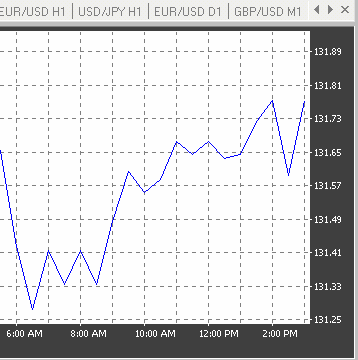
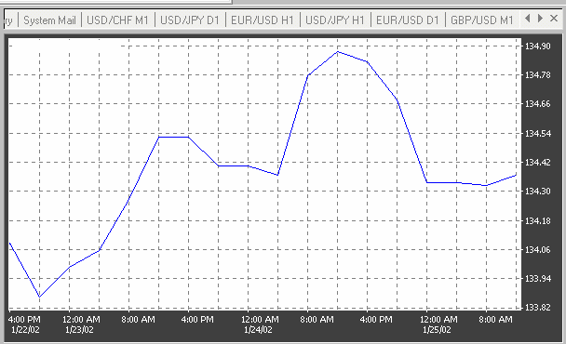
Figure 4.24. An example of a triple-bottom formation in the Japanese yen chart.
The head-and-shoulders, the double top and bottom and the triple top and bottom, due to their
significance in trend reversals, are generally known as major reversal patterns.
Rounded Top, Rounded Bottom, Saucer, Inverted Saucer. Rounded Top (See Figure 4.25),
Rounded Bottom (See Figure 4.26), Saucer (See Figure 4.27) and Inverted Saucer (See Figure 4.28)
patterns form as a result of a slow and gradual change in the direction of the market. These patterns reflect the indecision of the market at the end of a trend. The trading activity is slow. It is impossible to know when the formation is indeed completed, and not for a lack of trying. Though is known that the longer it takes to complete patterns, the higher is the likelihood of a sharp price move in the new direction.
Figure 4.25. An example of a rounded top formation in the Japanese yen chart.
2001 by Royal Forex. All right reserved. www.royalforex.com
37
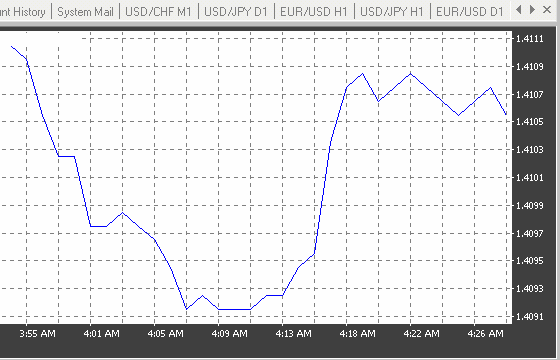
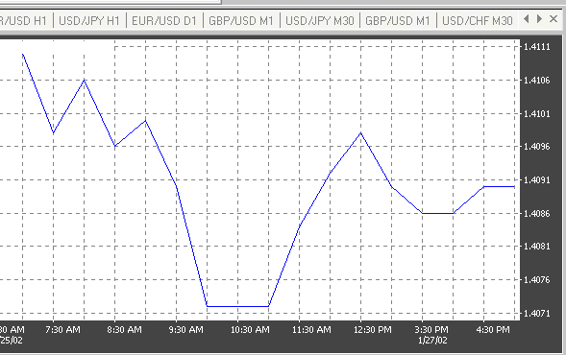
Figure 4.26. An example of a rounded bottom formation in the Pound Sterling chart.
Figure 4.27. An example of a saucer formation in the Pound Sterling chart.
2001 by Royal Forex. All right reserved. www.royalforex.com
38
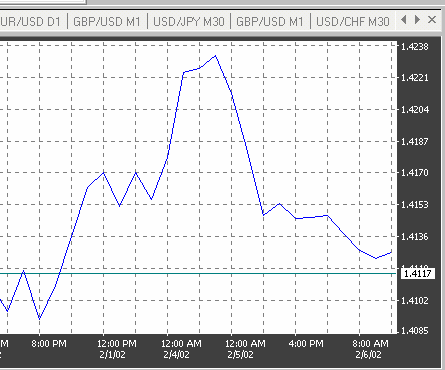
Figure 4.28. An example of an inverted saucer formation in the Pound Sterling chart.