Figure 4. 42. Diagram of a typical bearish rectangle
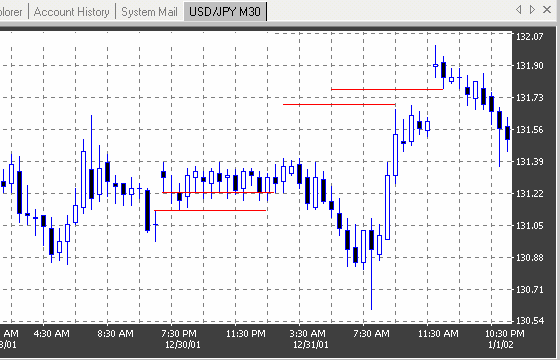
Figure 4.43. Example of a bearish rectangle in the Euro chart.
2001 by Royal Forex. All right reserved. www.royalforex.com
46